- Step 1 of 17
Your starting point
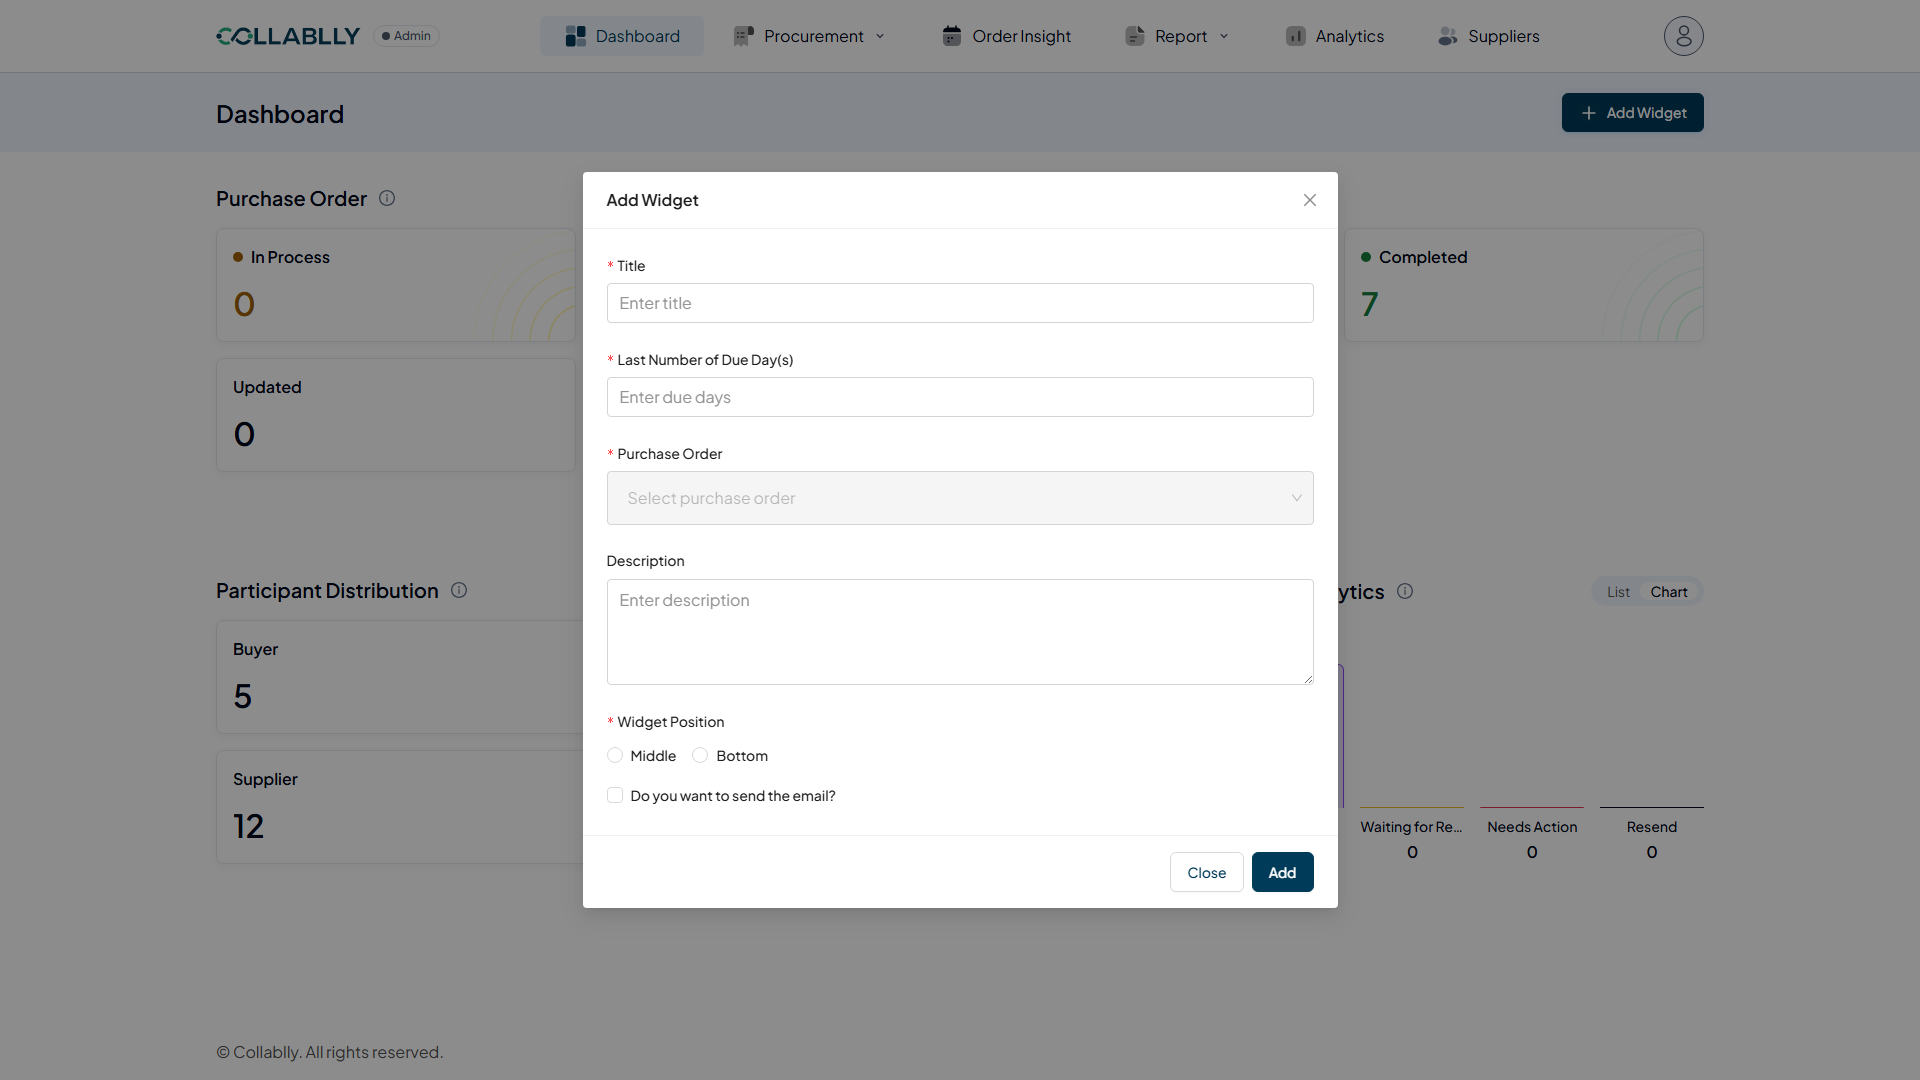
The Dashboard is the first screen you see after signing in to Collablly SRM 2.1. You can return to it at any time by selecting Dashboard from the top navigation.
- Step 2 of 17
What the Dashboard shows
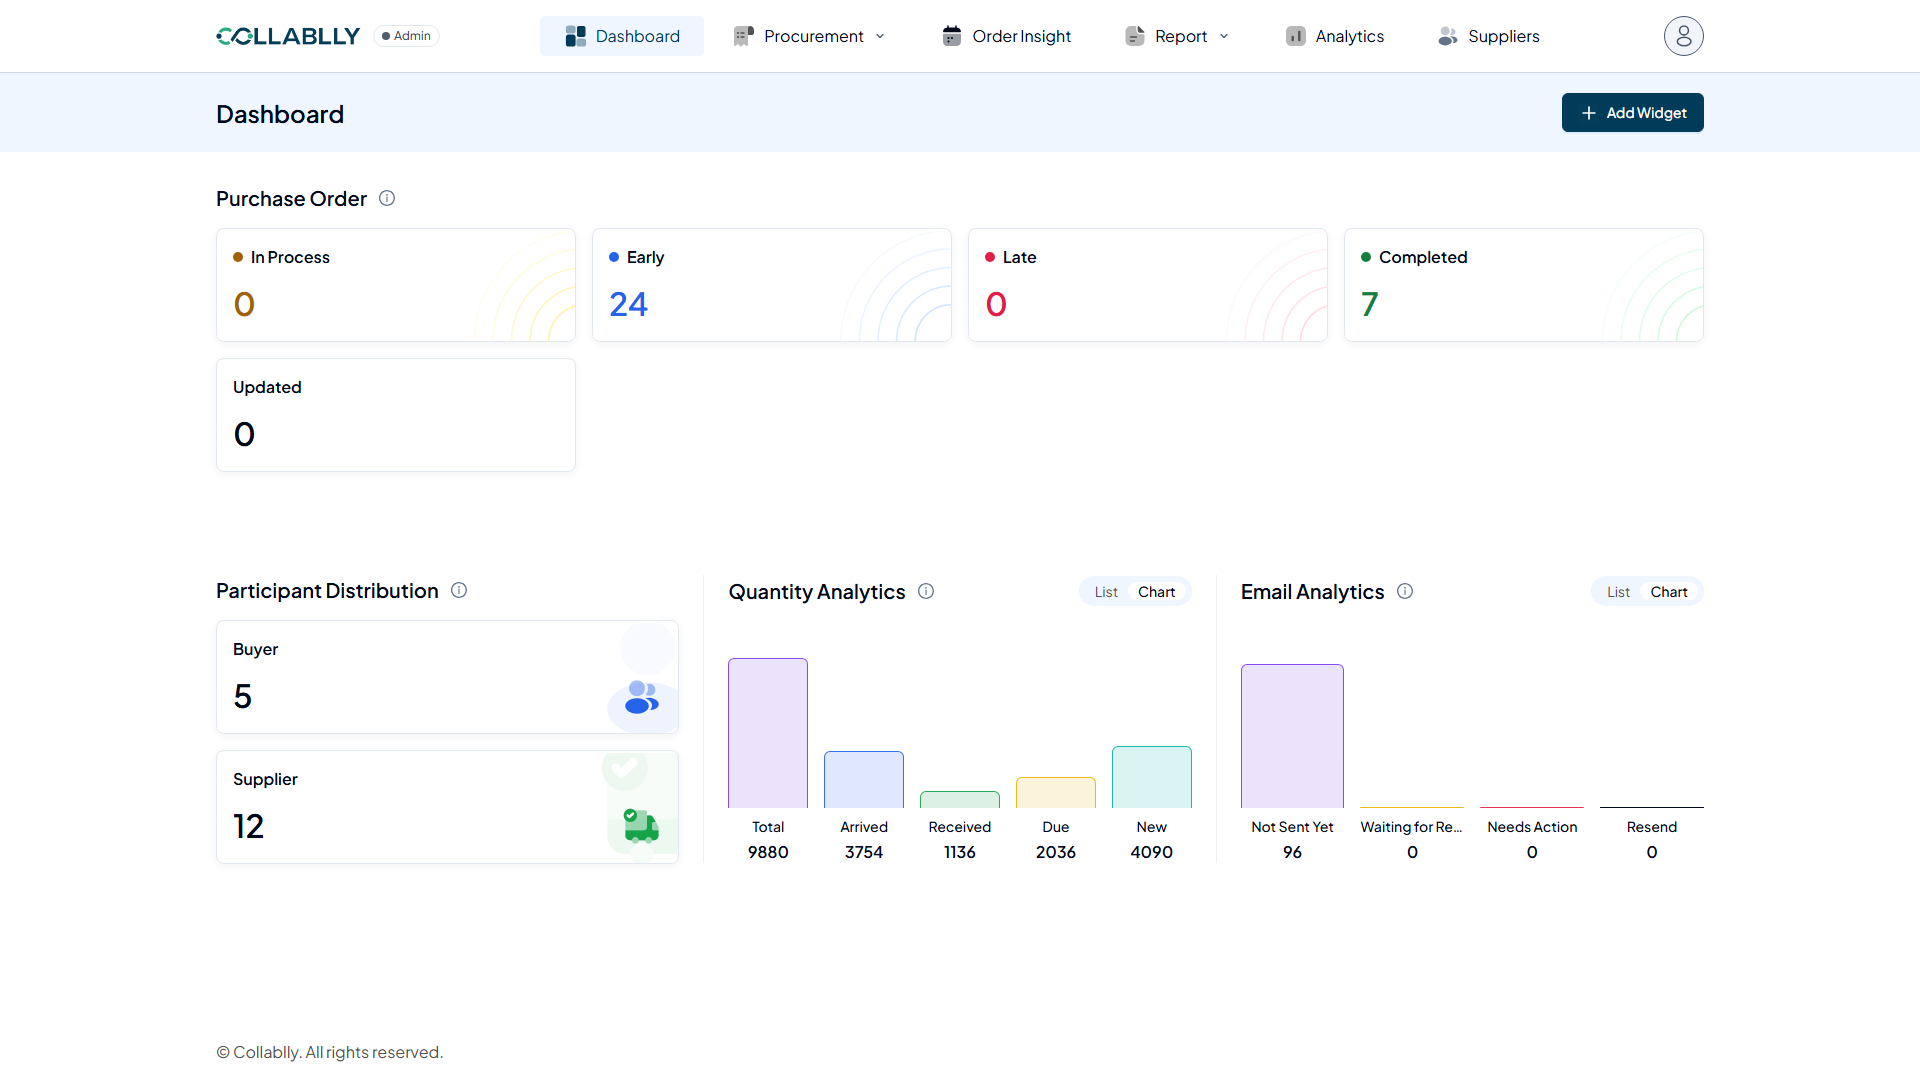
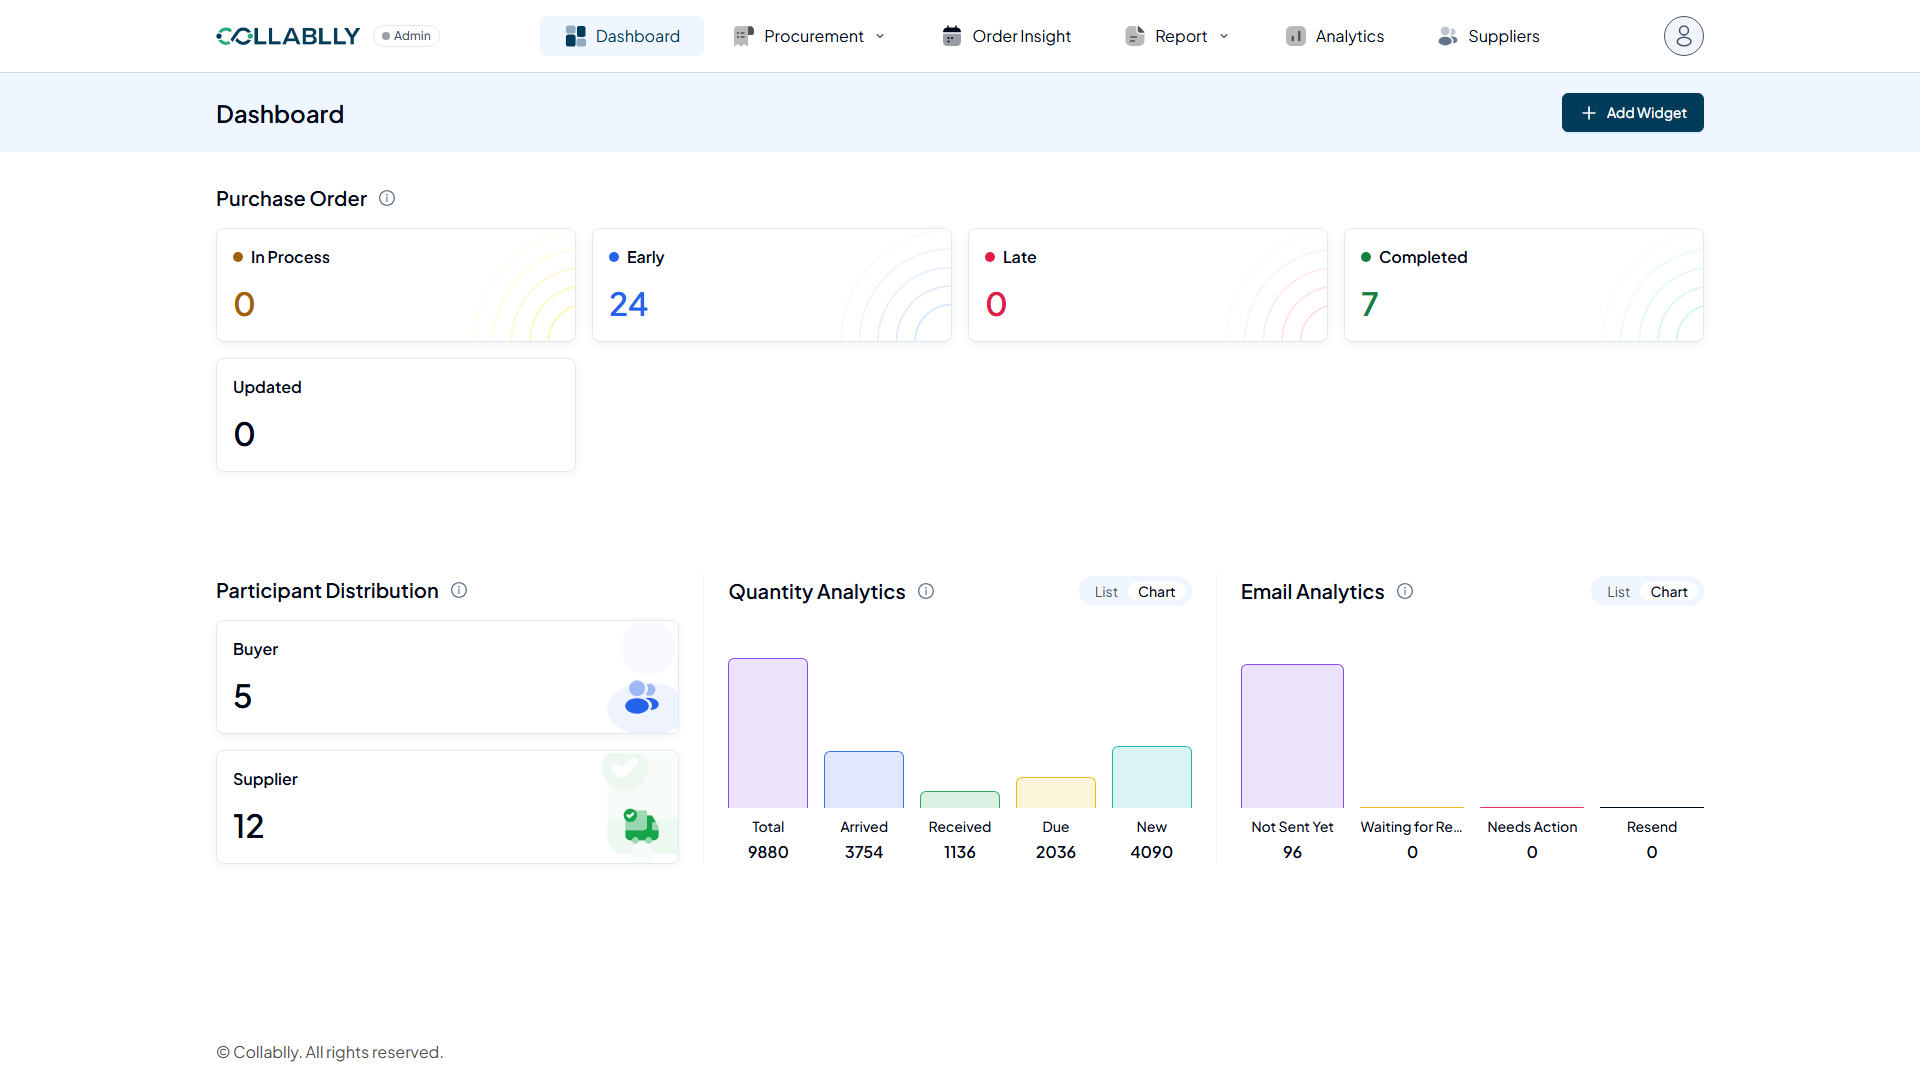
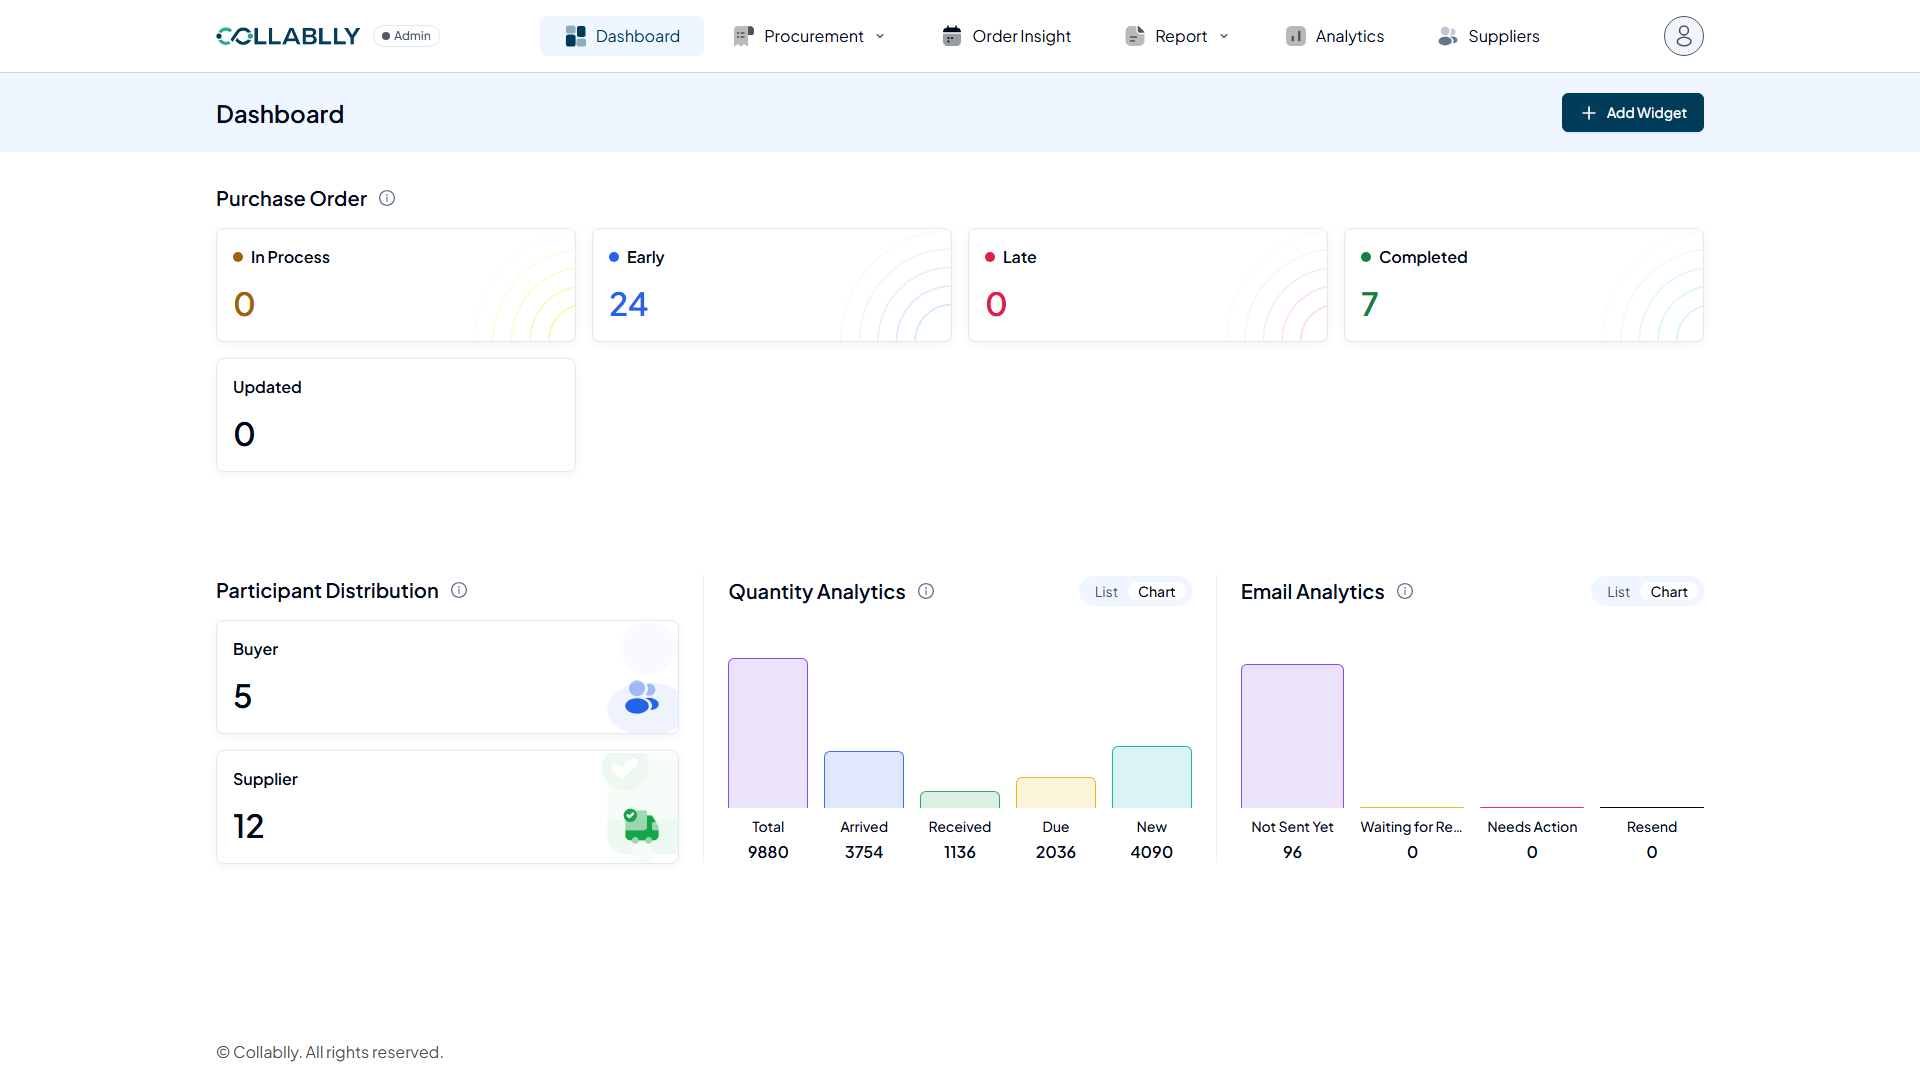
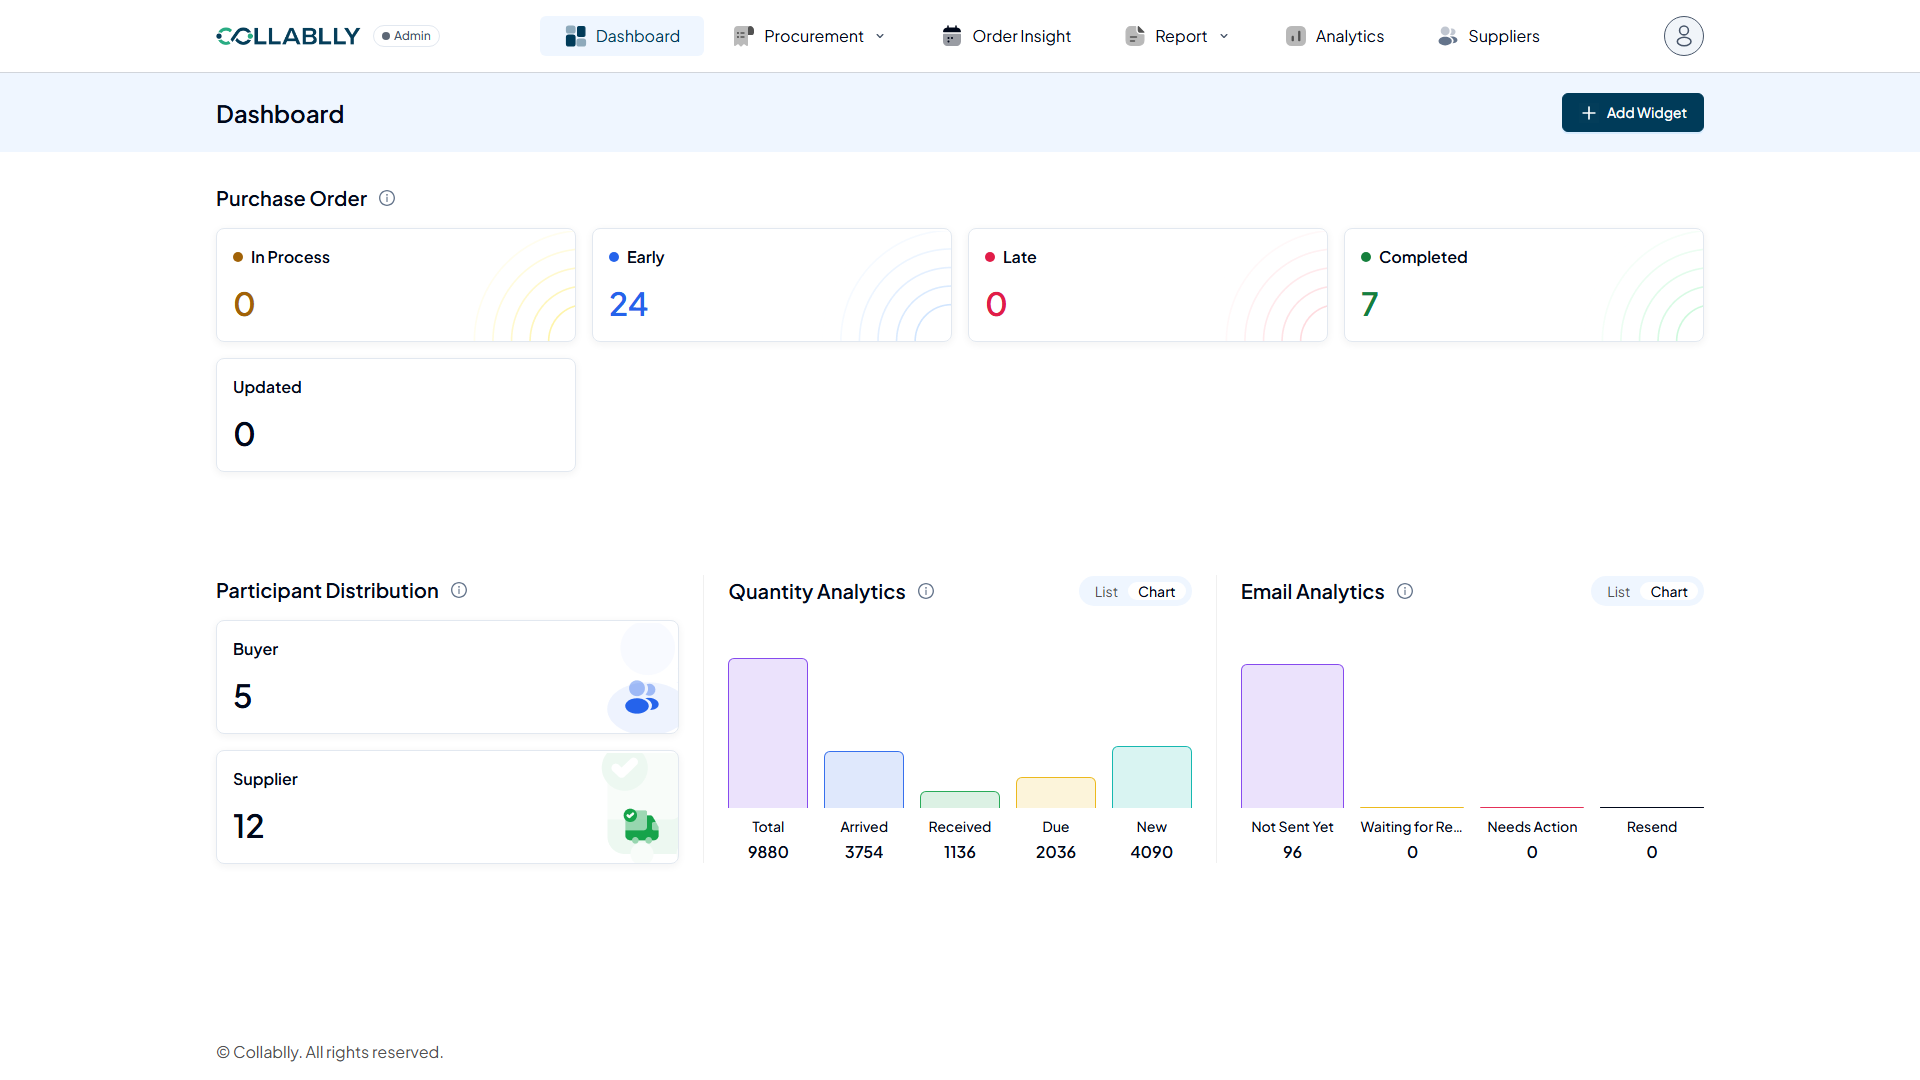
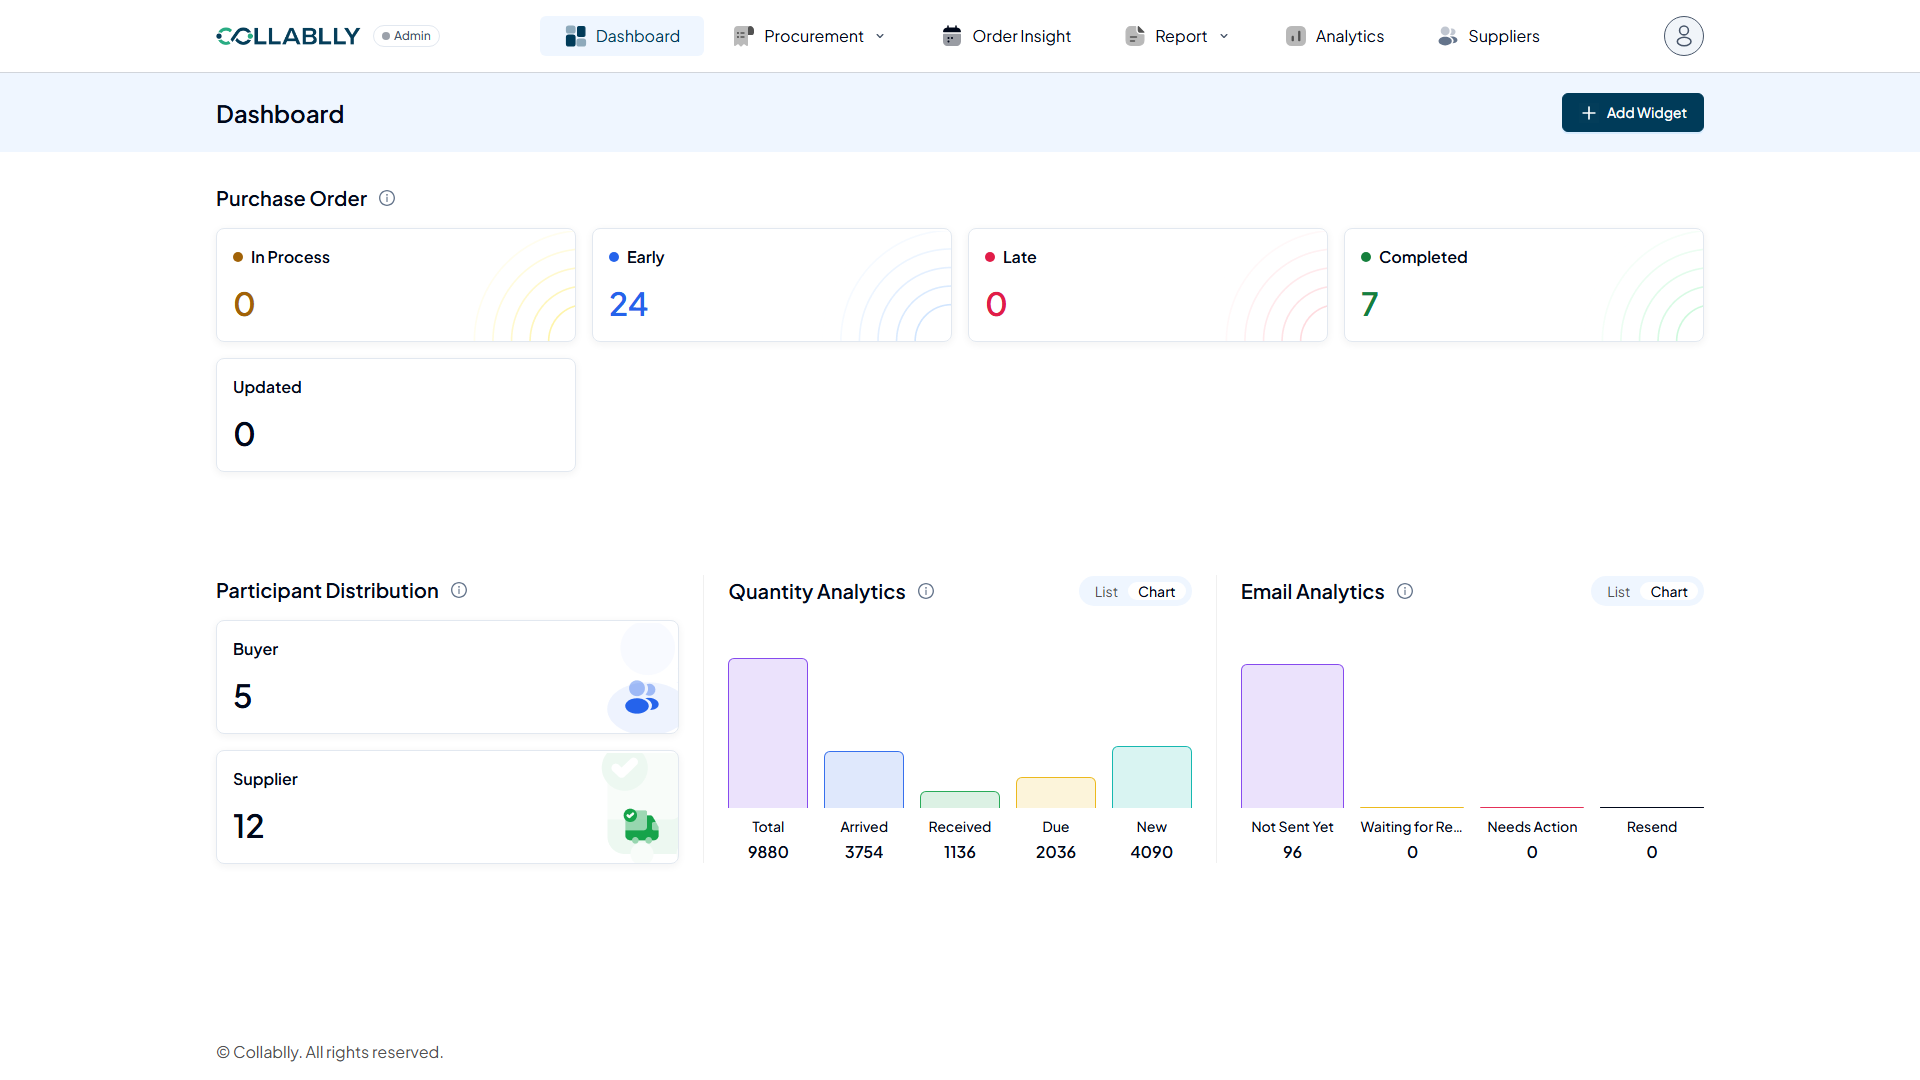
The Dashboard gives you an at a glance view of your procurement activity: purchase order status, buyer and supplier counts, and two analytics charts. Nothing here needs to be filled in. It is a summary you can click through to drill into details.
- Step 3 of 17
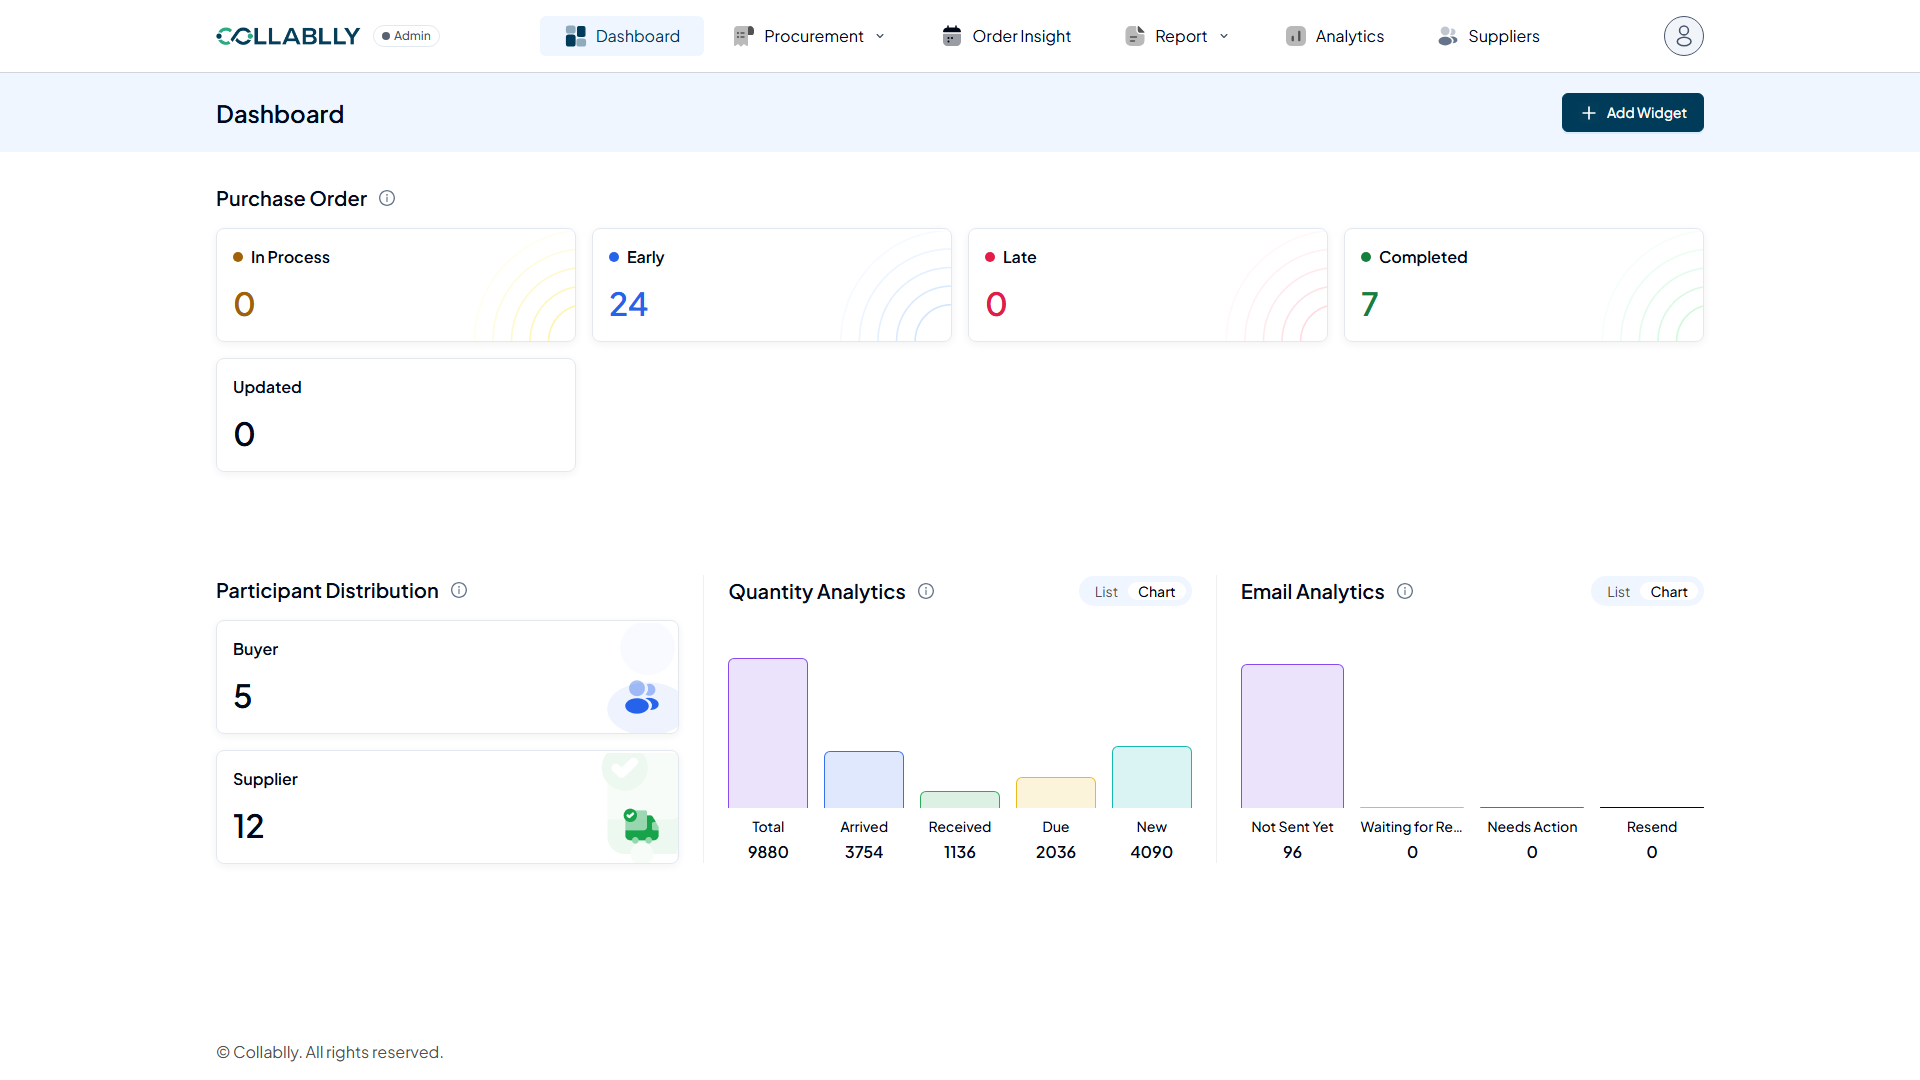
Purchase Order status: In Process
Purchase orders that are active and being tracked, not yet at their due date. Click the tile to open the filtered Purchase Order list.
- Step 4 of 17
Purchase Order status: Early
Purchase orders tracking ahead of schedule. Click the tile to see them in the Purchase Order list.
- Step 5 of 17
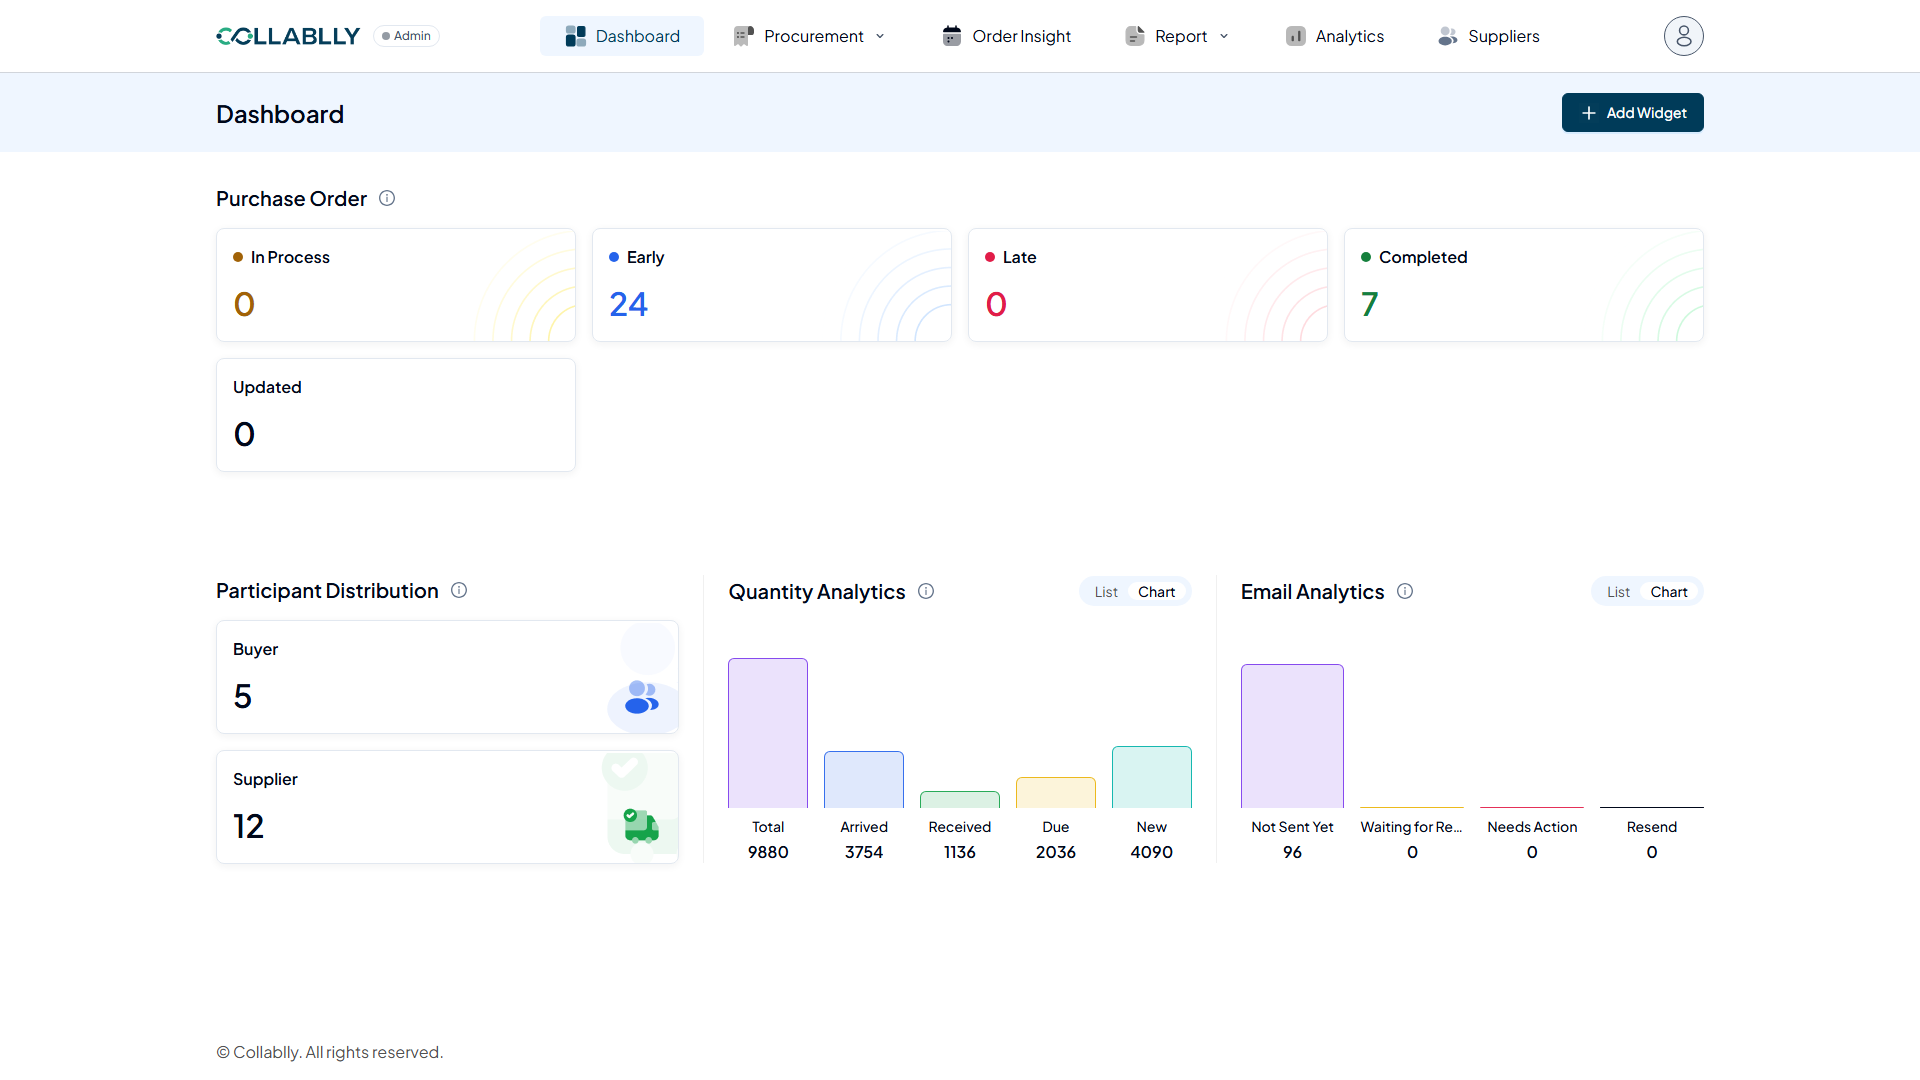
Purchase Order status: Late
Purchase orders past their expected date without being completed. These typically need the most attention.
- Step 6 of 17
Purchase Order status: Completed
Purchase orders that have been fully received and closed out.
- Step 7 of 17
Purchase Order status: Updated
Purchase order lines that were recently changed using Mass PO Update.
- Step 8 of 17
Buyer count
How many buyer accounts are set up in this tenant.
- Step 9 of 17
Supplier count
How many supplier accounts are set up in this tenant.
- Step 10 of 17
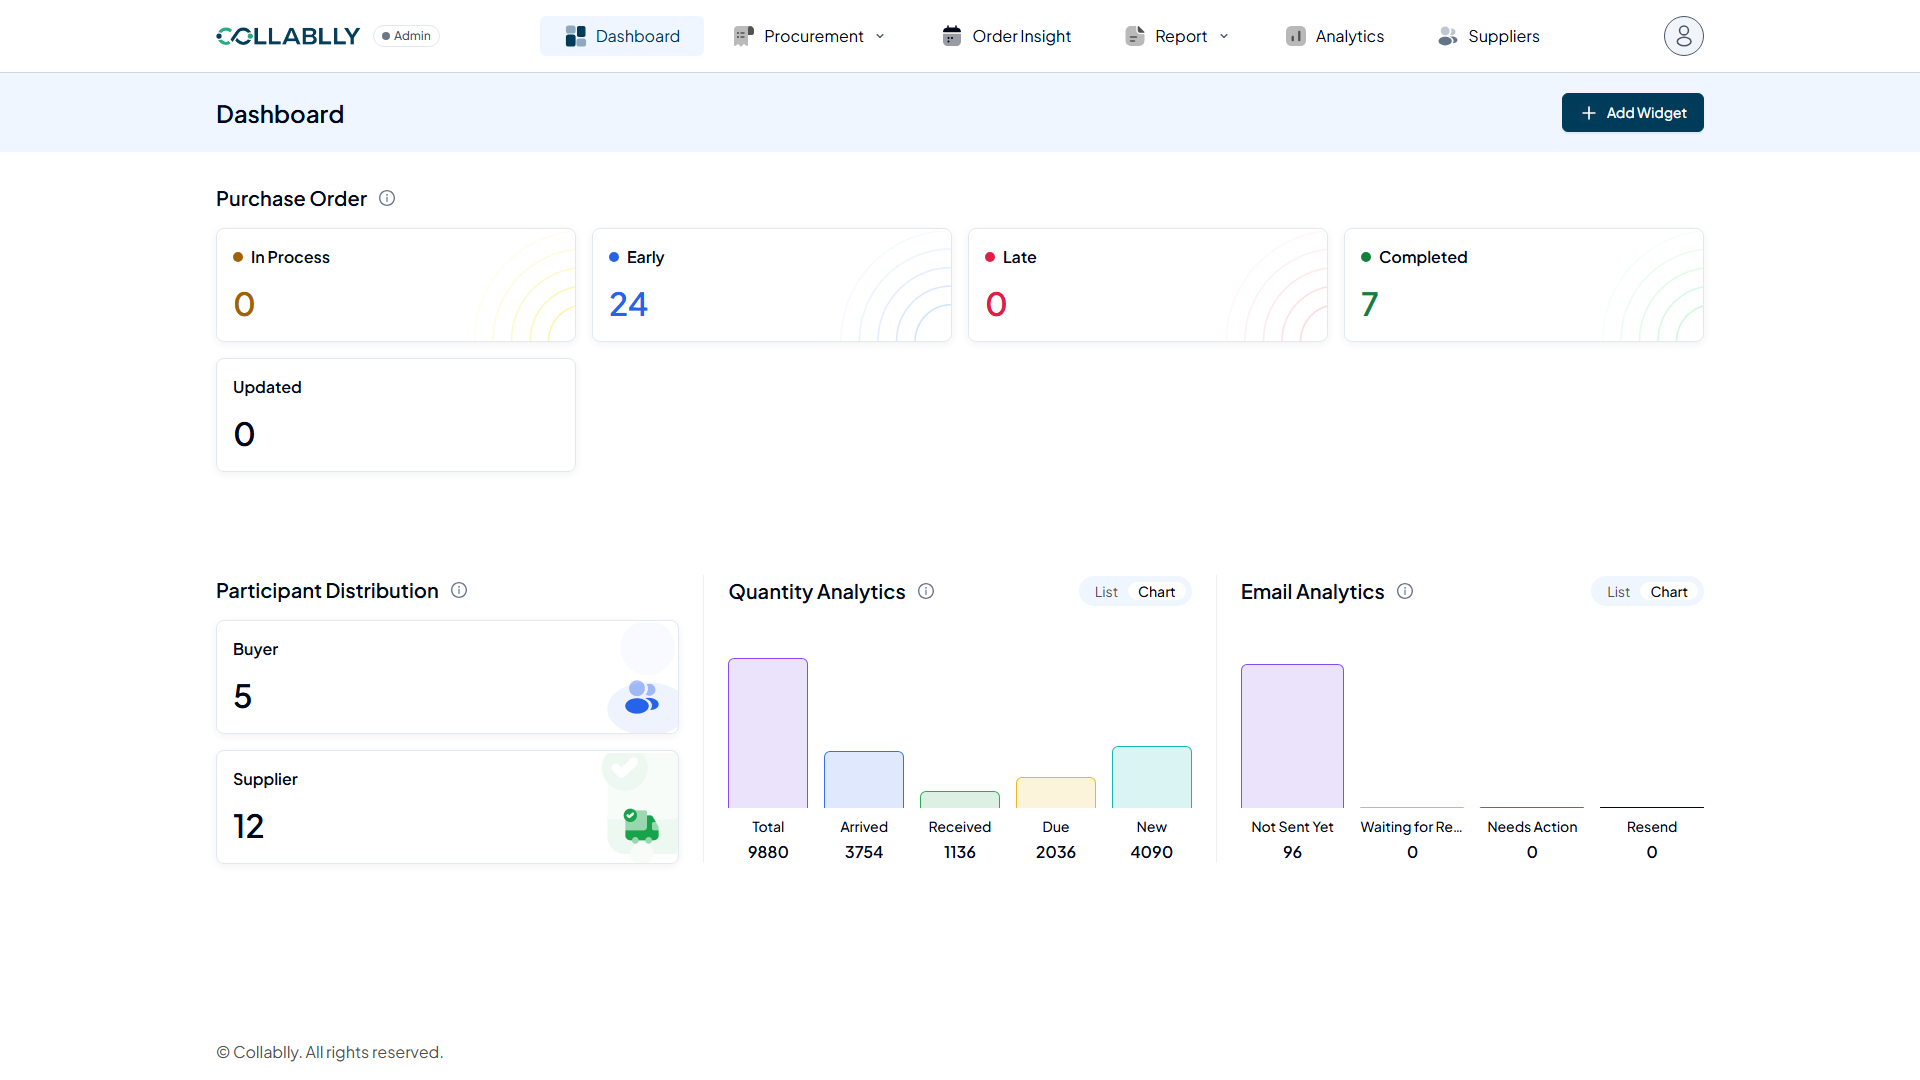
Quantity Analytics
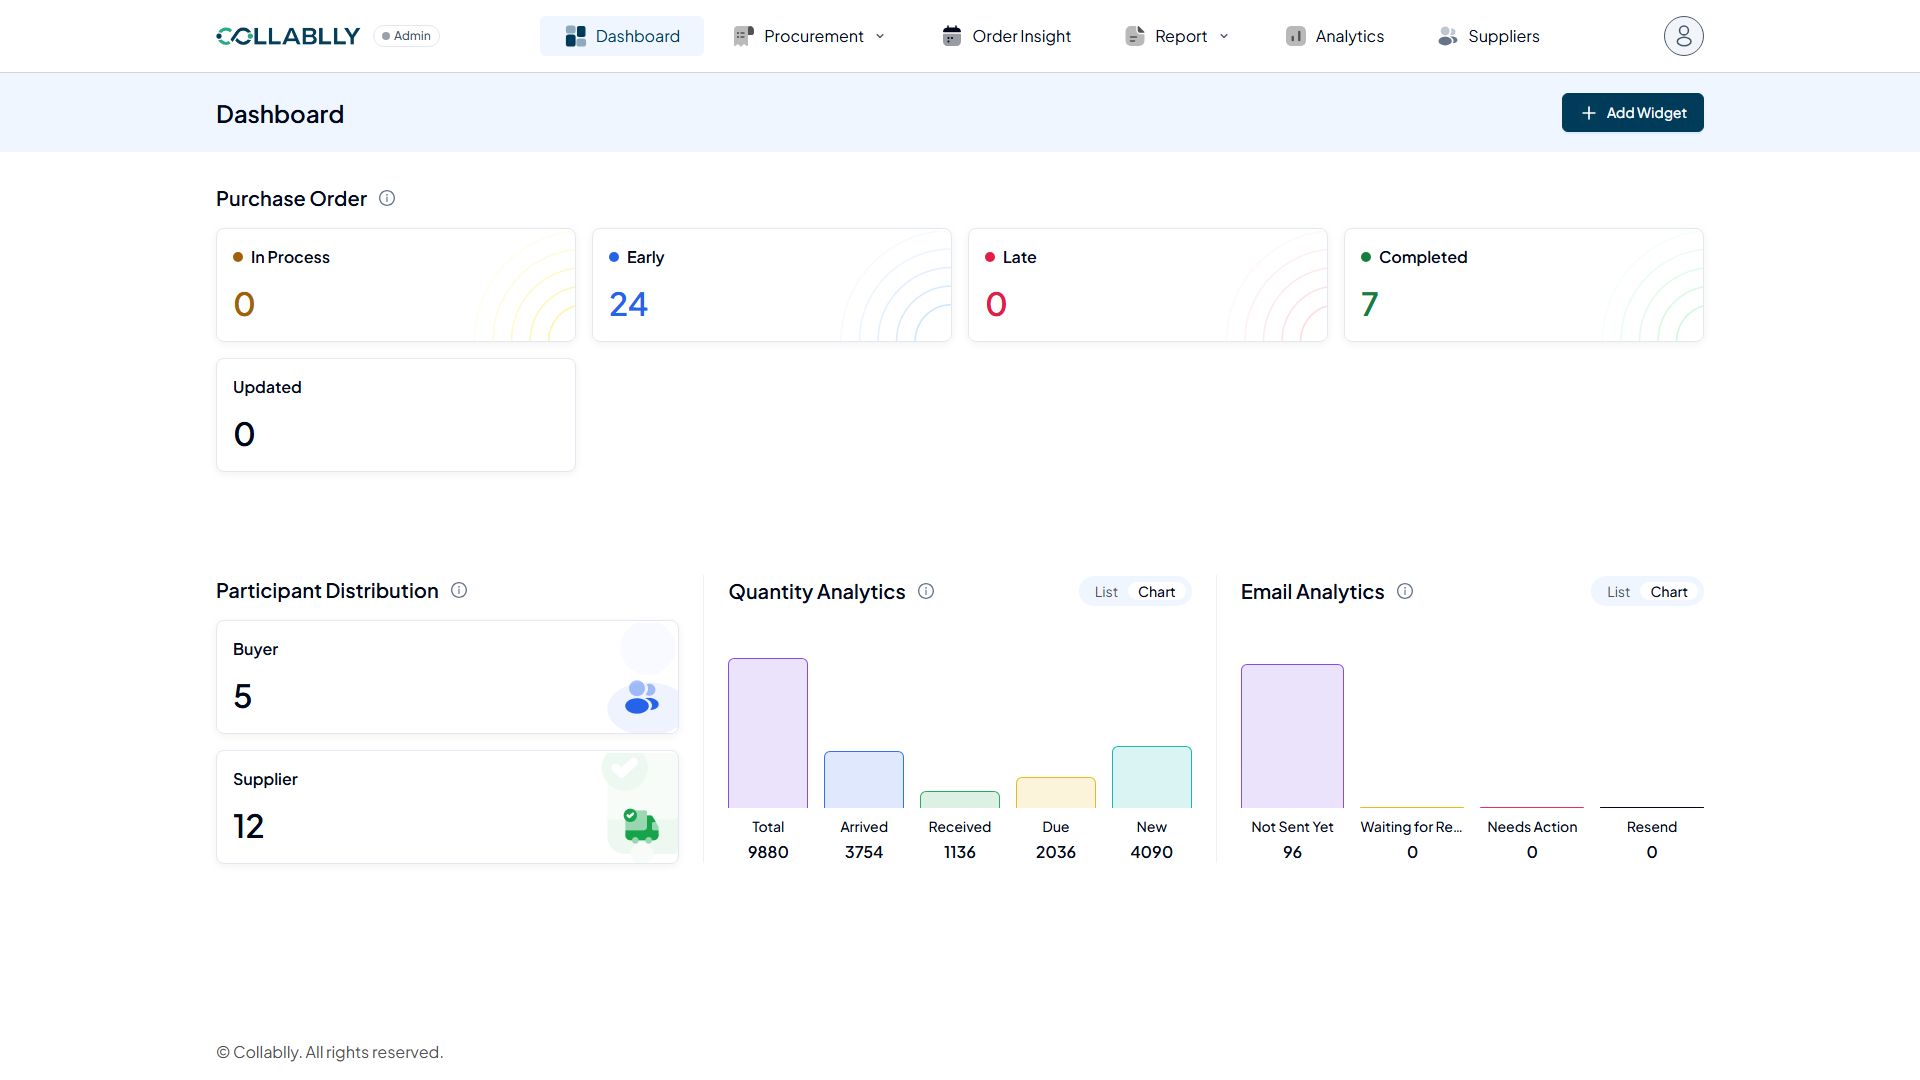
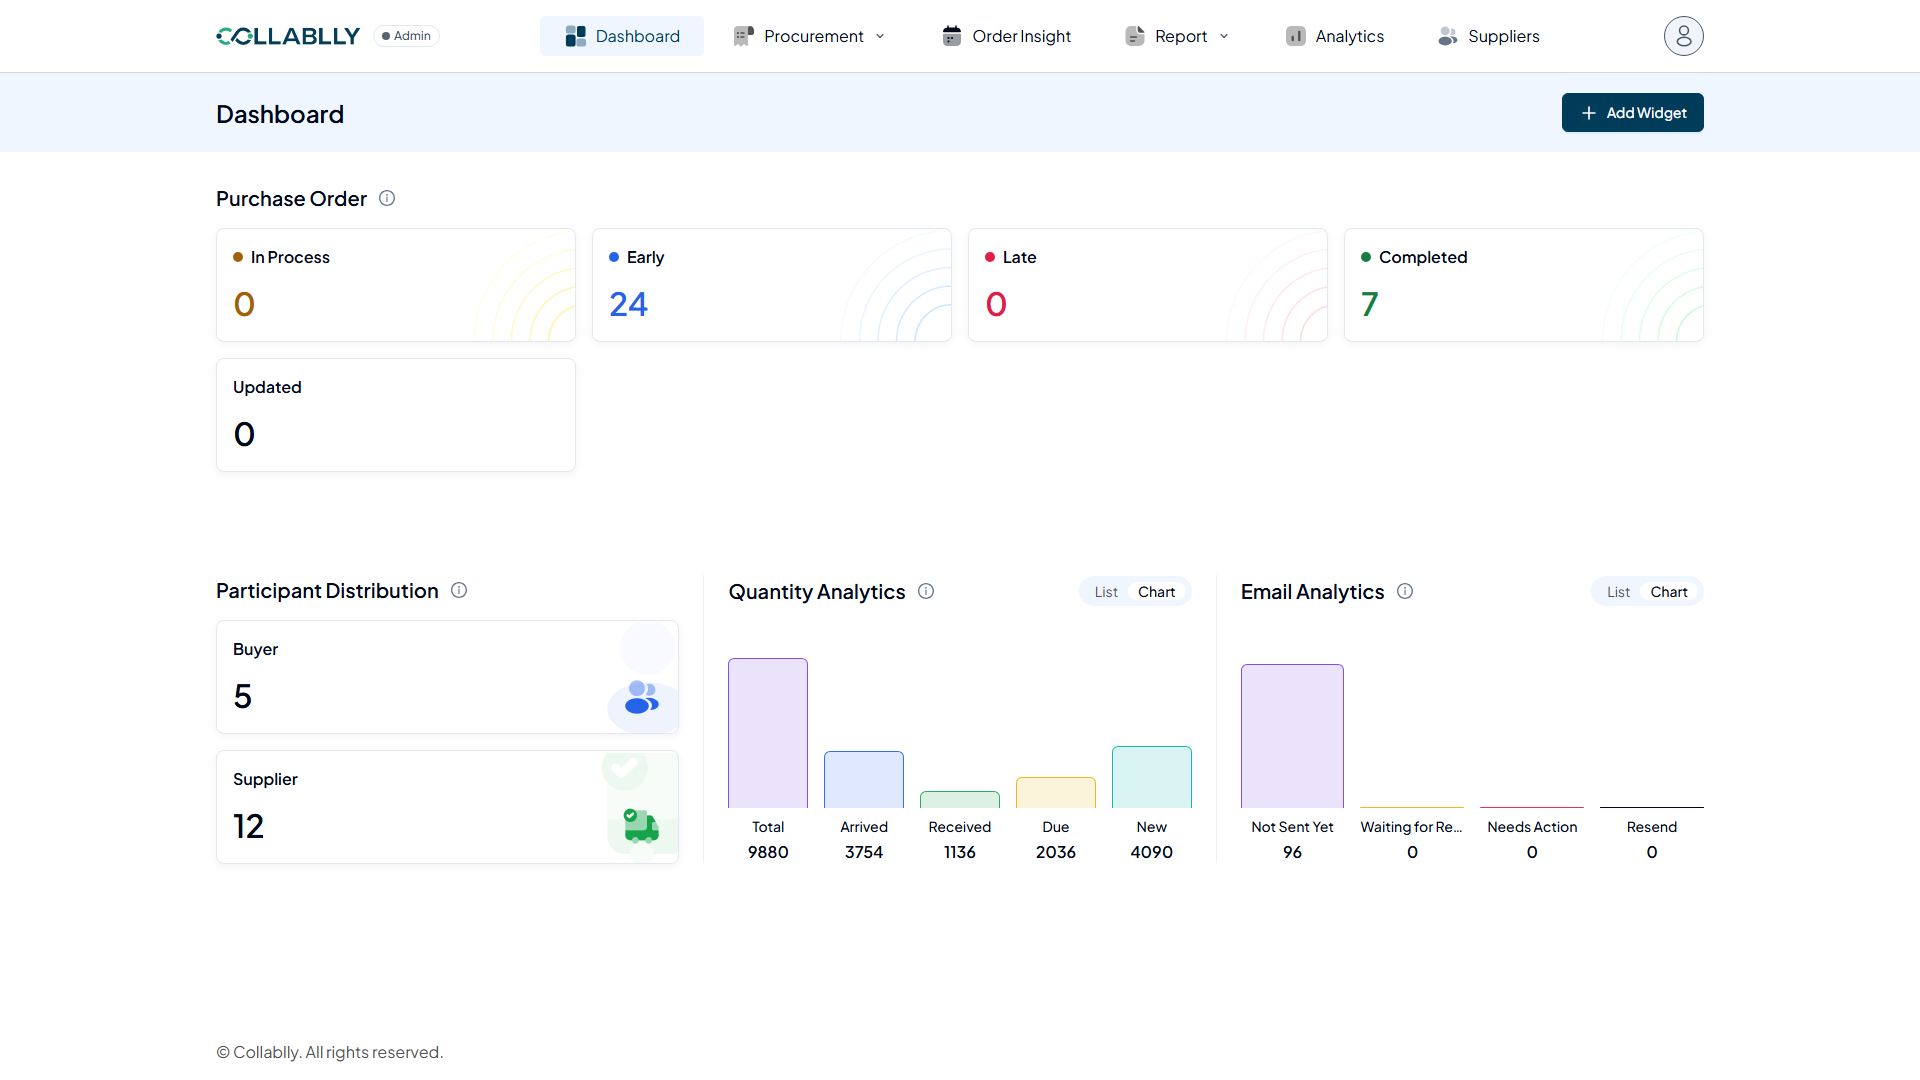
A running breakdown of purchase order quantities: how many units are on order in total, how many have arrived, how many are confirmed received, how many are still due, and how many are new.
- Step 11 of 17
Switch to List view
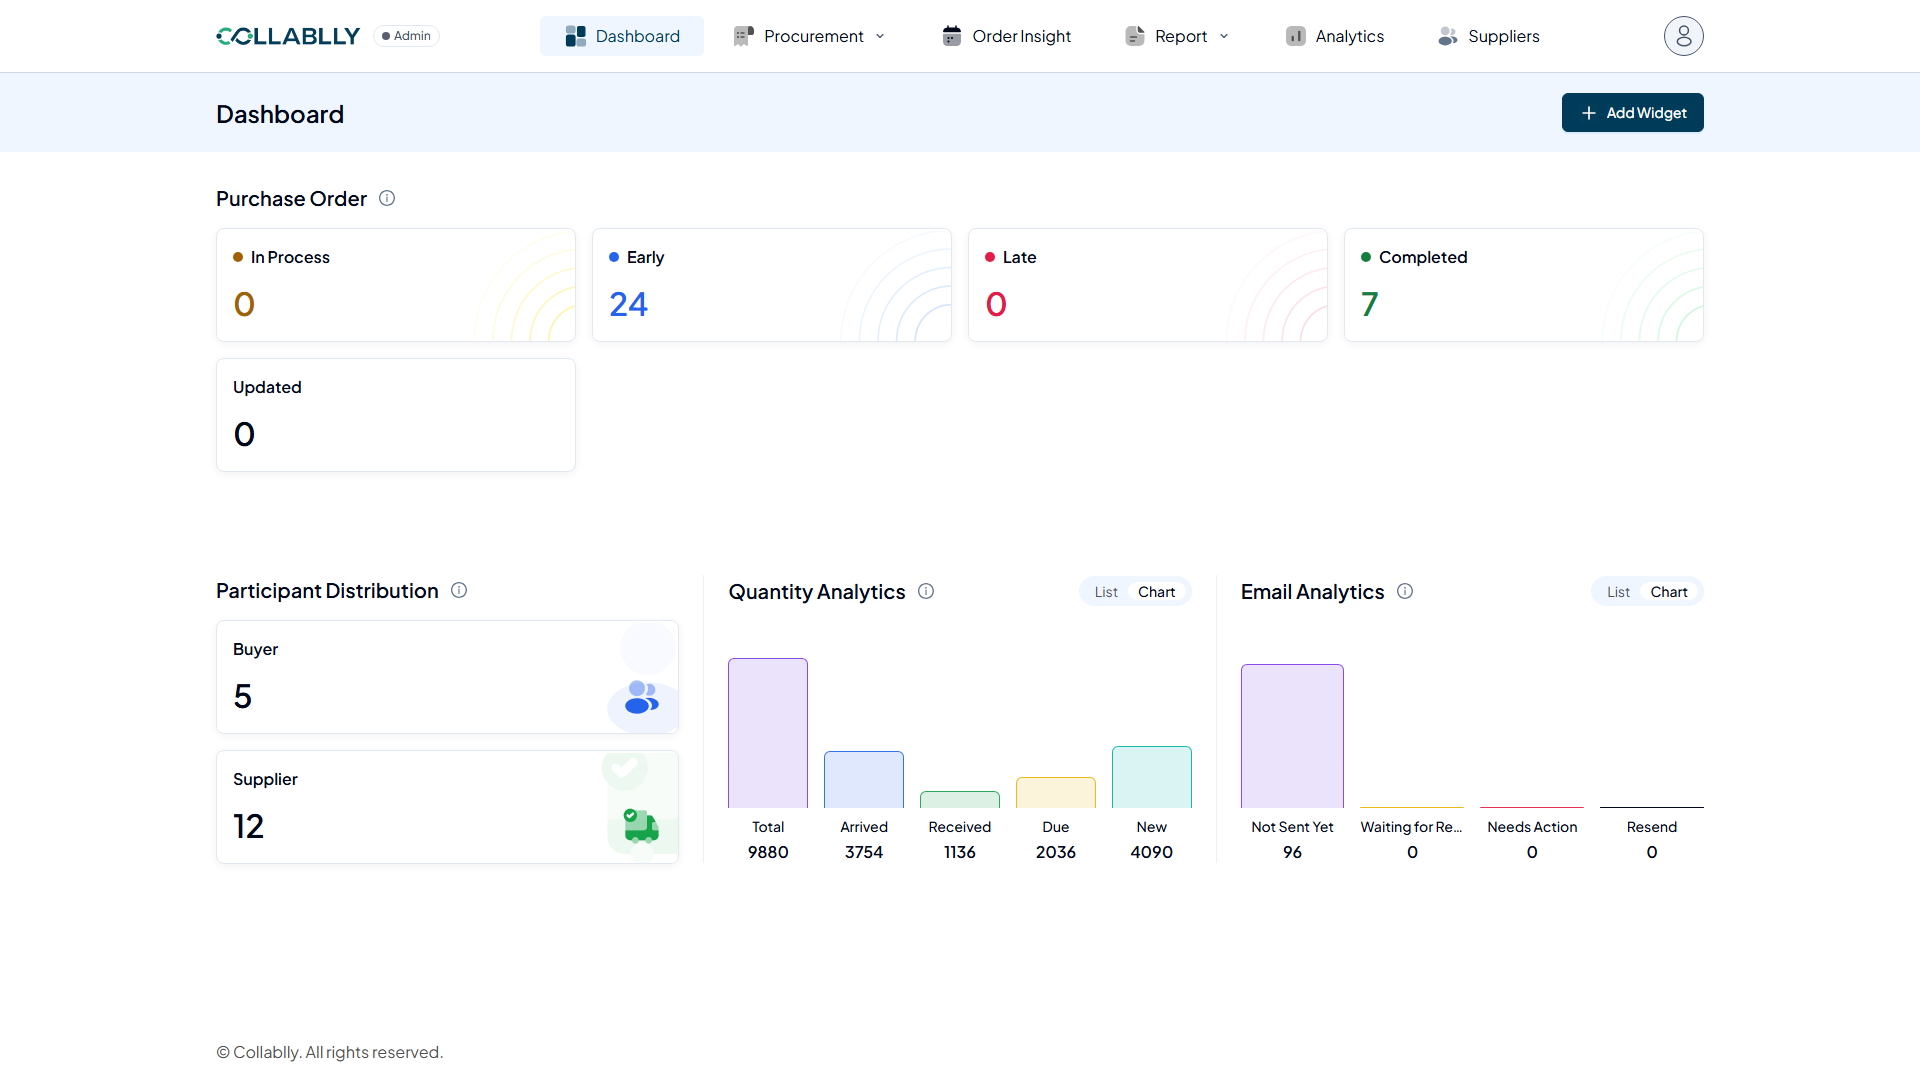
Click List instead of Chart any time you want the same numbers as a plain table rather than a bar chart.
- Step 12 of 17
The List view
Same five counts, just in table form. Click Chart to switch back any time.
- Step 13 of 17
Email Analytics
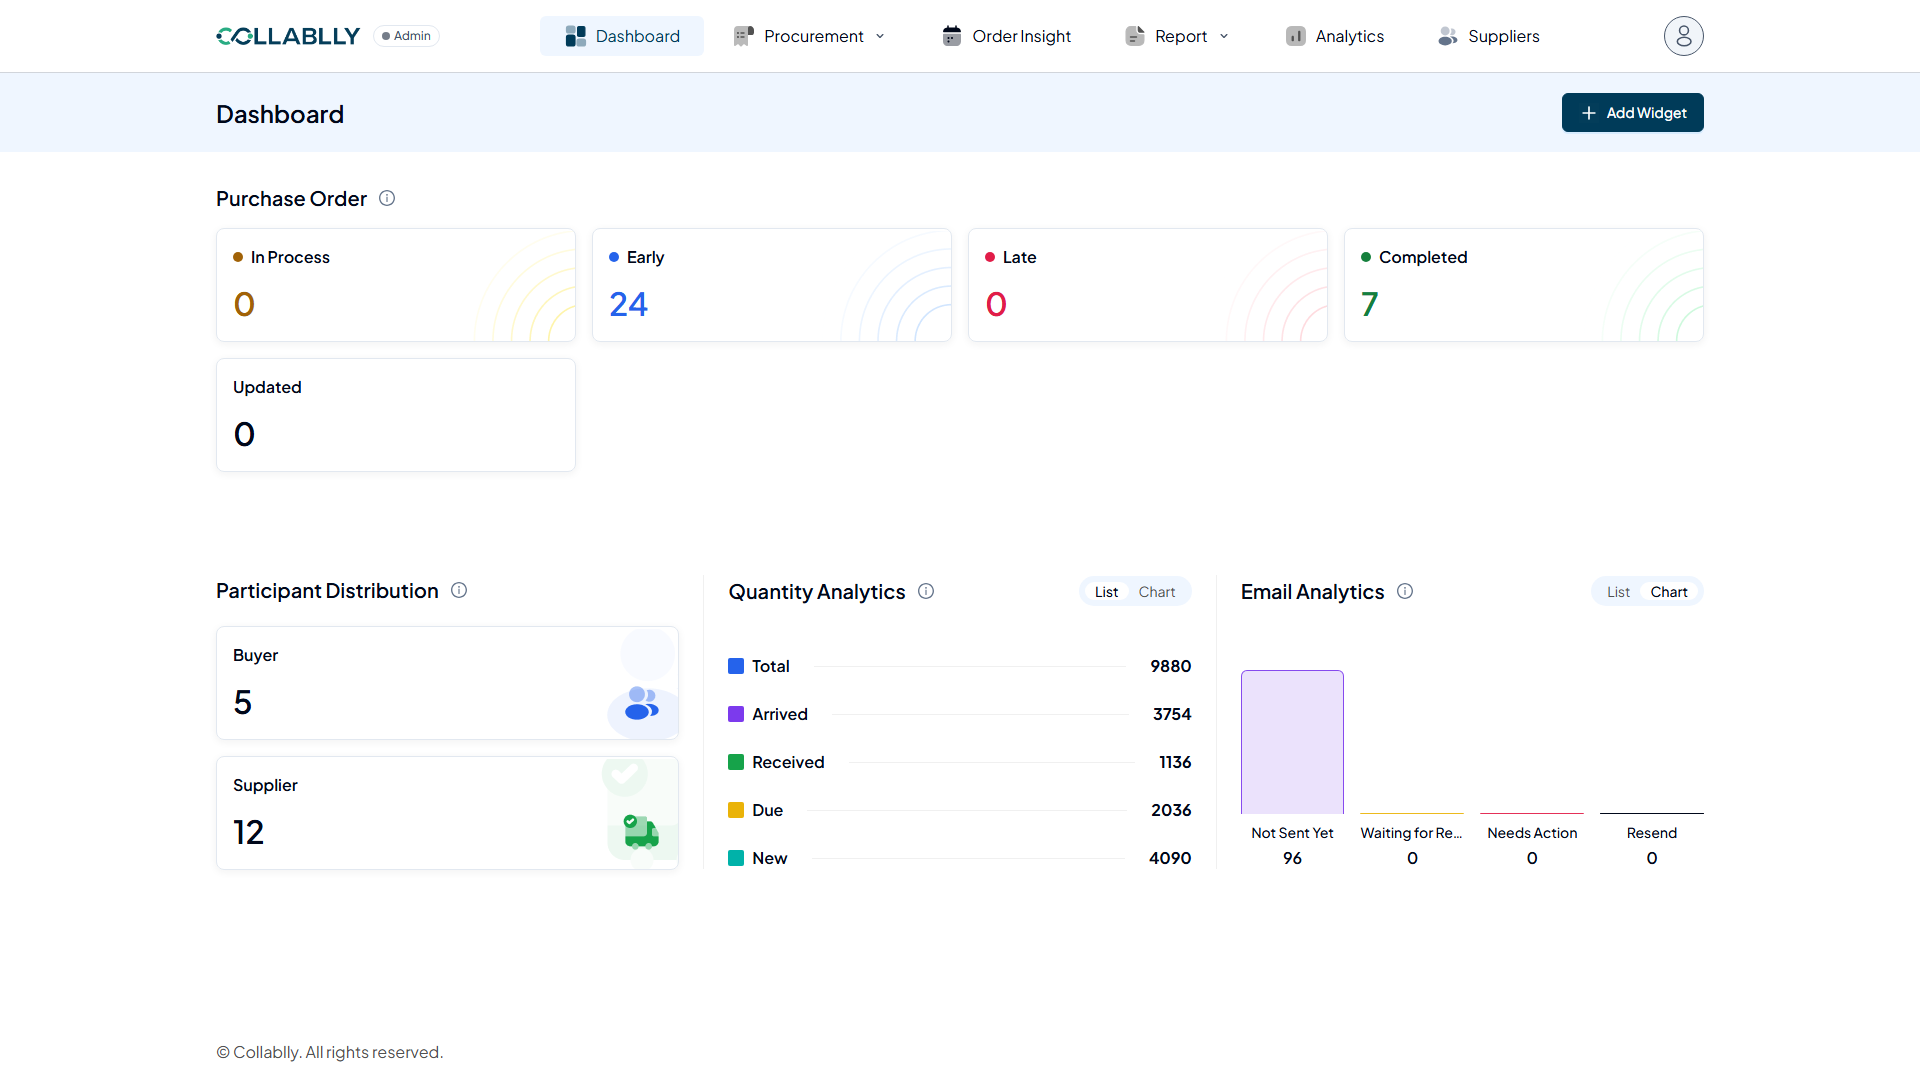
Tracks the status of PO notification emails sent to suppliers: how many have not been sent yet, how many are waiting on a supplier reply, how many need your action, and how many should be resent.
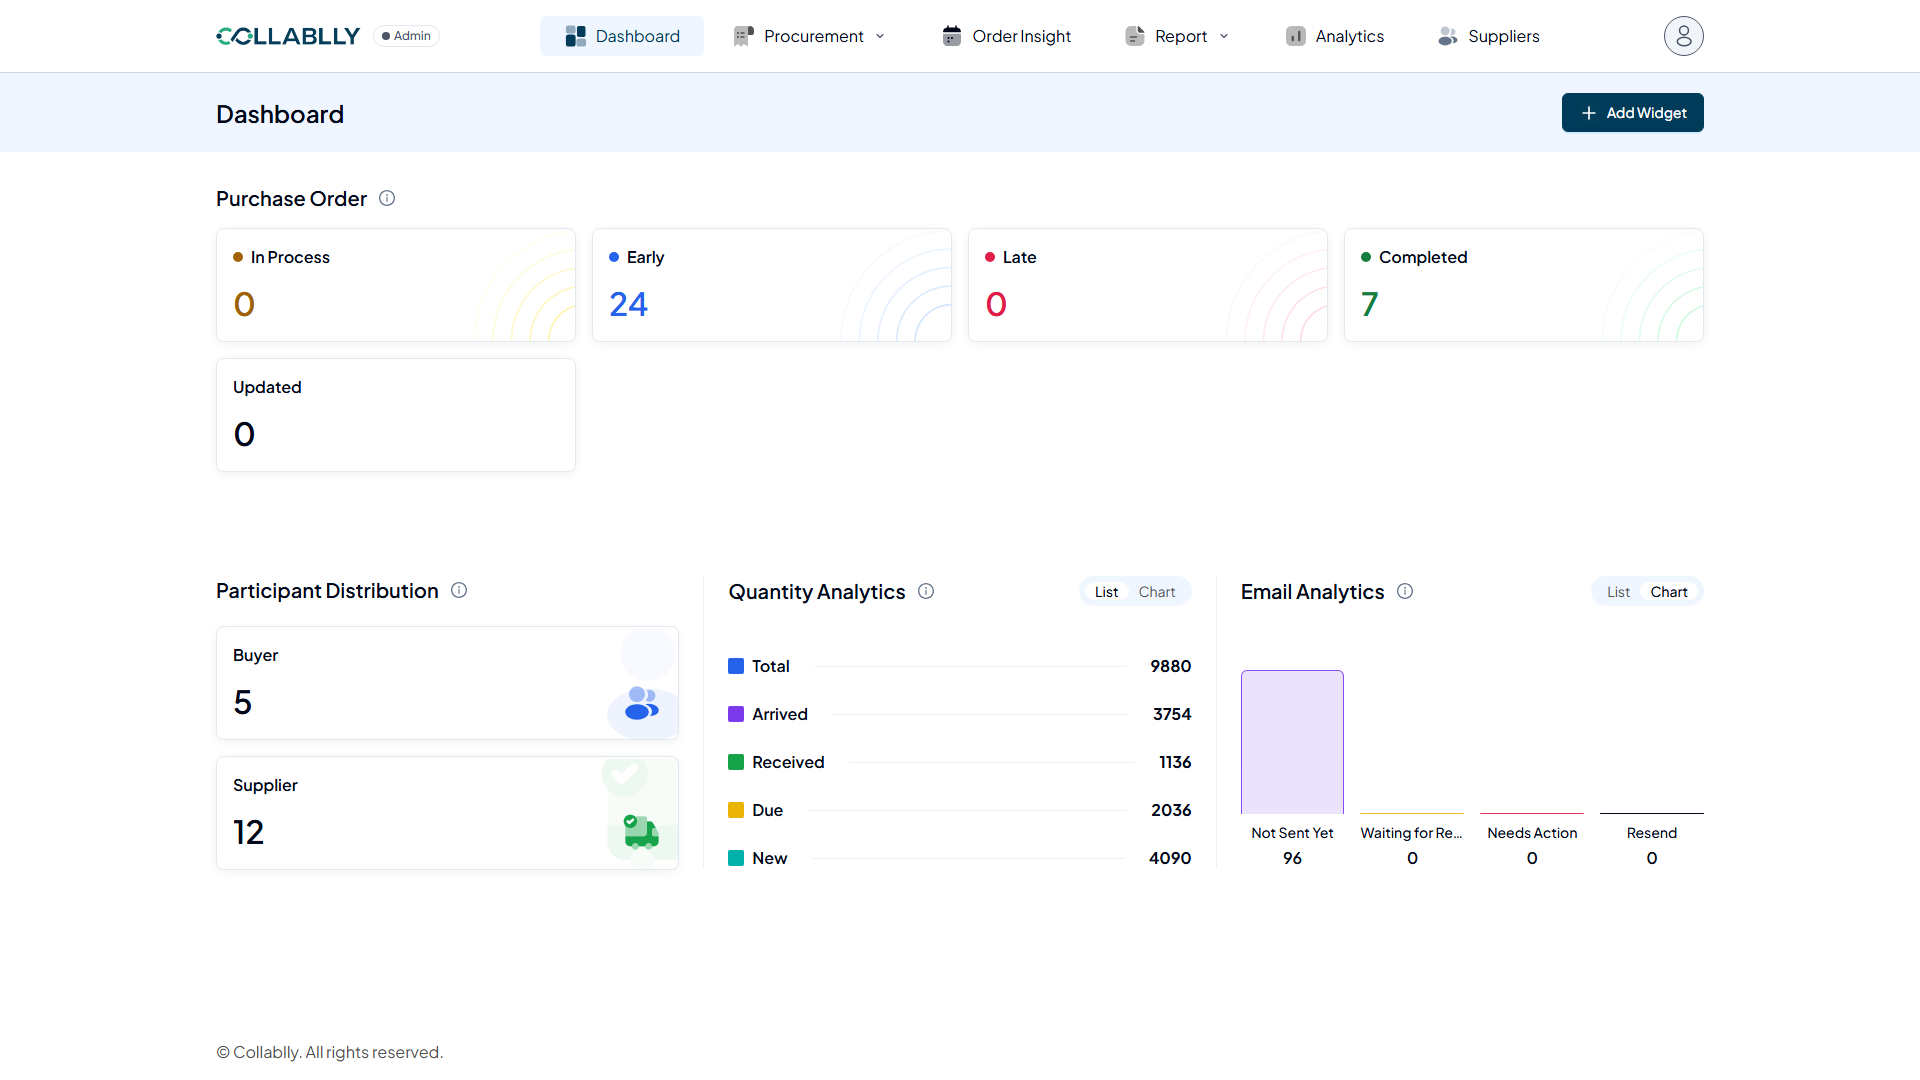
- Step 14 of 17
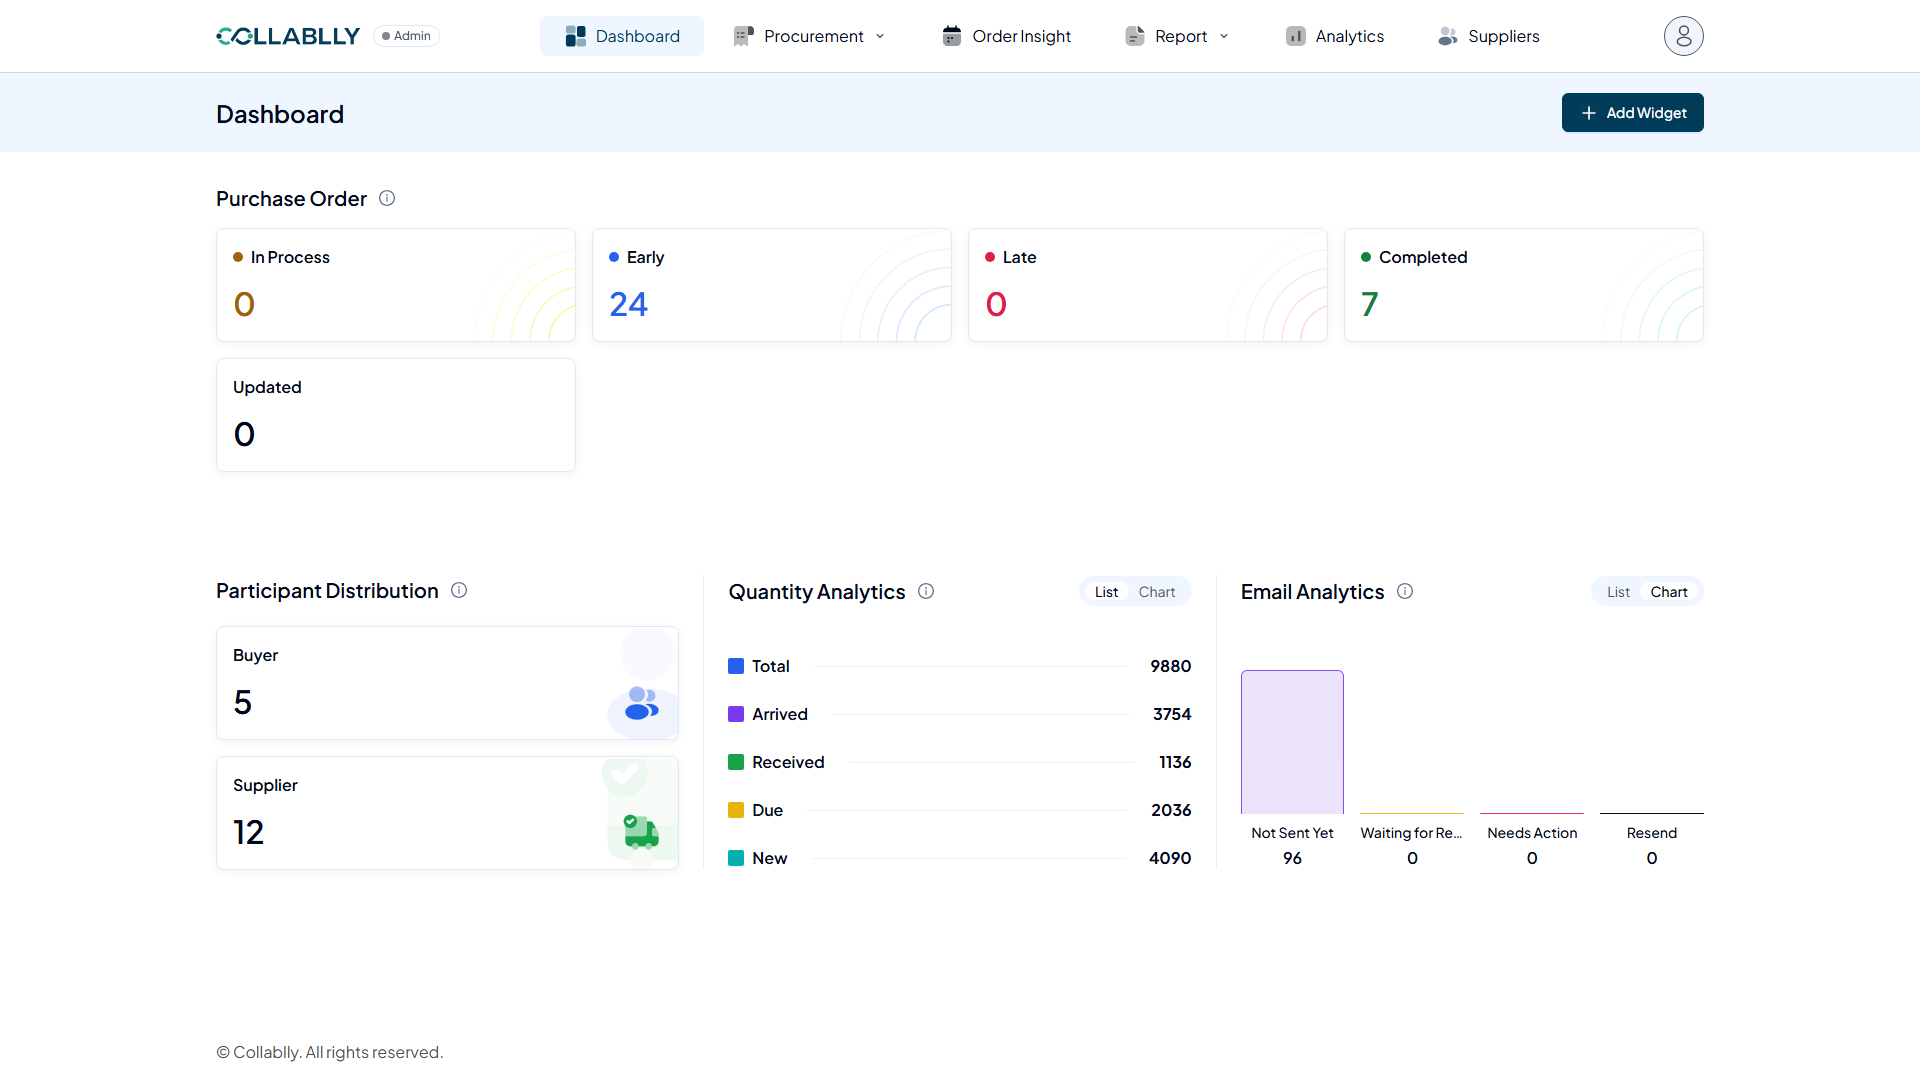
Switch to List view
Same idea here. List swaps the bar chart for a table of the same counts.
- Step 15 of 17
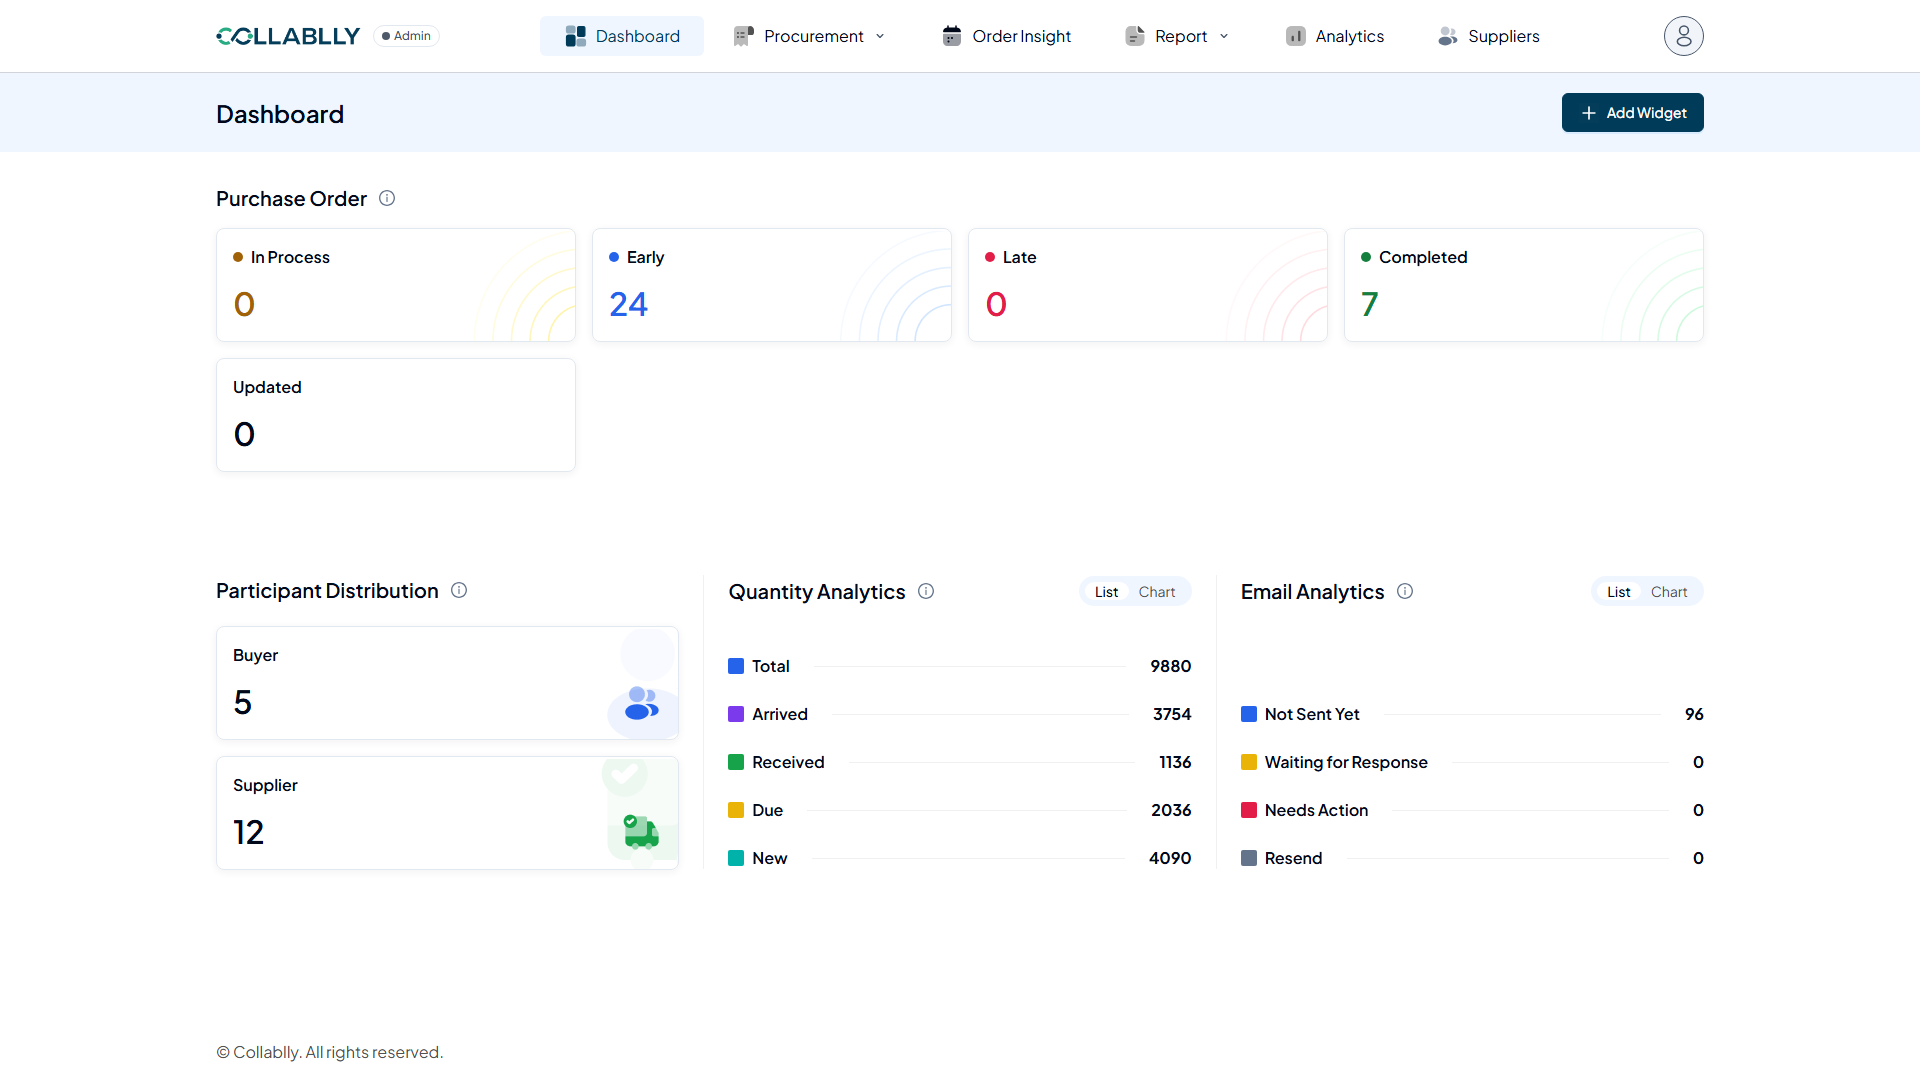
The List view
Same four counts, just in table form. Click Chart to switch back any time.
- Step 16 of 17
Add Widget
Add Widget lets you build your own custom tile: give it a title and description, then set a number of due days. The system automatically pulls in every purchase order due within that window.
- Step 17 of 17
A closer look
Here is the form it opens to: Title, Last Number of Due Day(s), a Purchase Order selector, an optional Description, Widget Position, and whether to send an email. We will walk through filling this out and saving a widget in its own dedicated guide. For now, just know it is here whenever you want a custom view.