- Step 1 of 12
Open Analytics
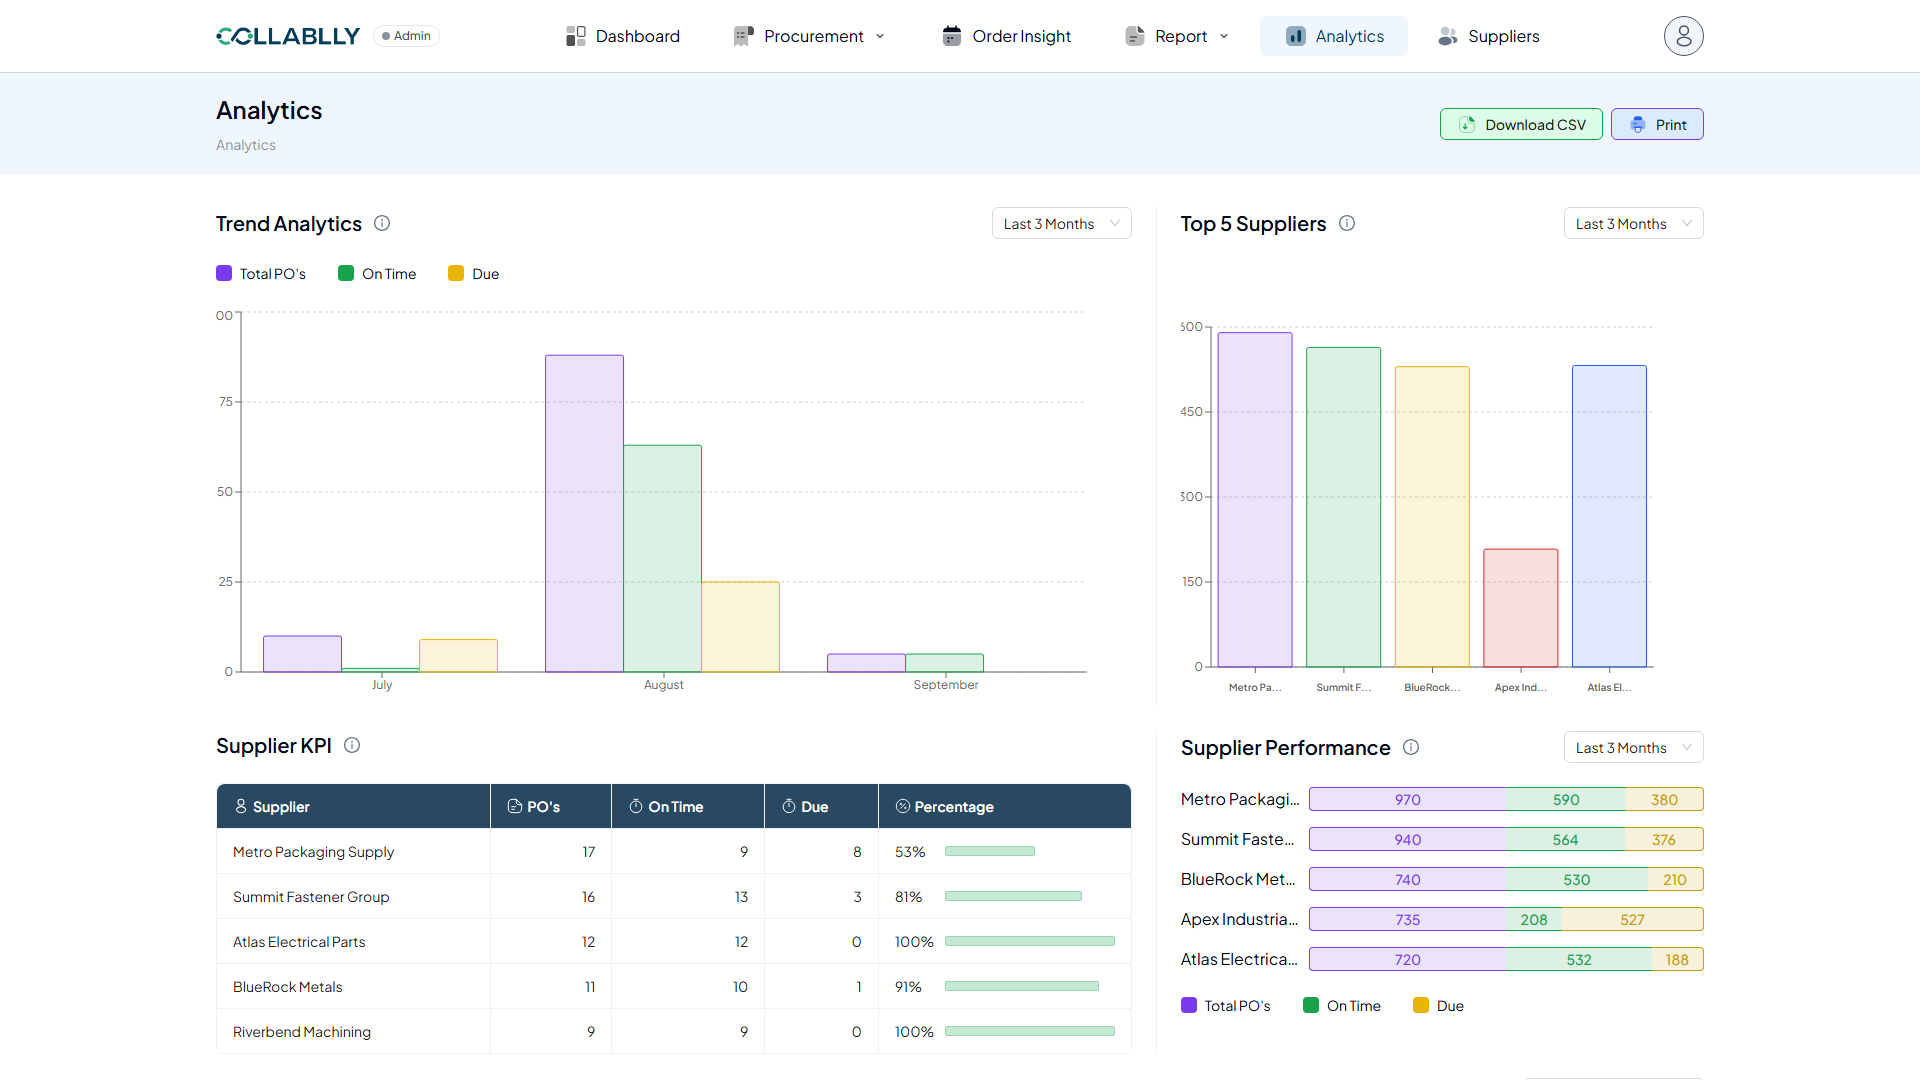
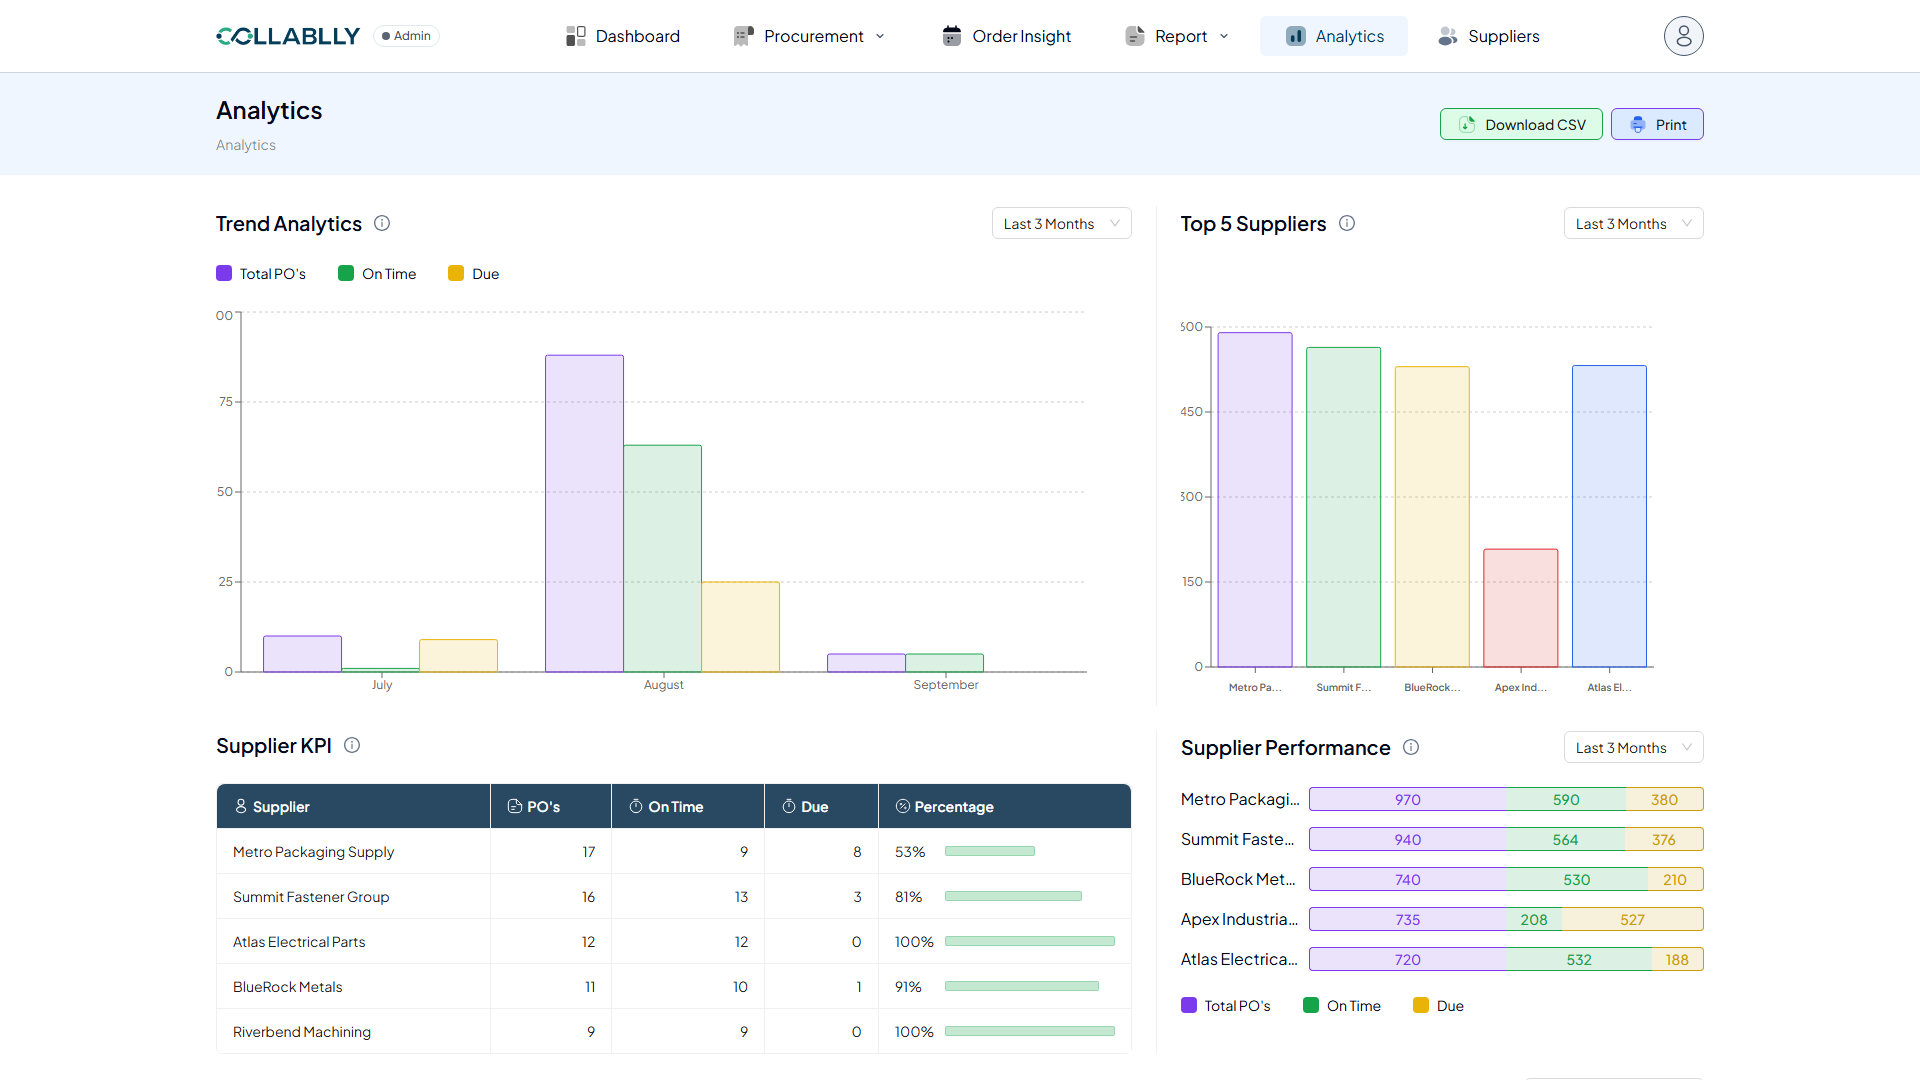
From the top navigation, select Analytics. This page brings together trend, supplier, and part-sourcing reporting in one view.
- Step 2 of 12
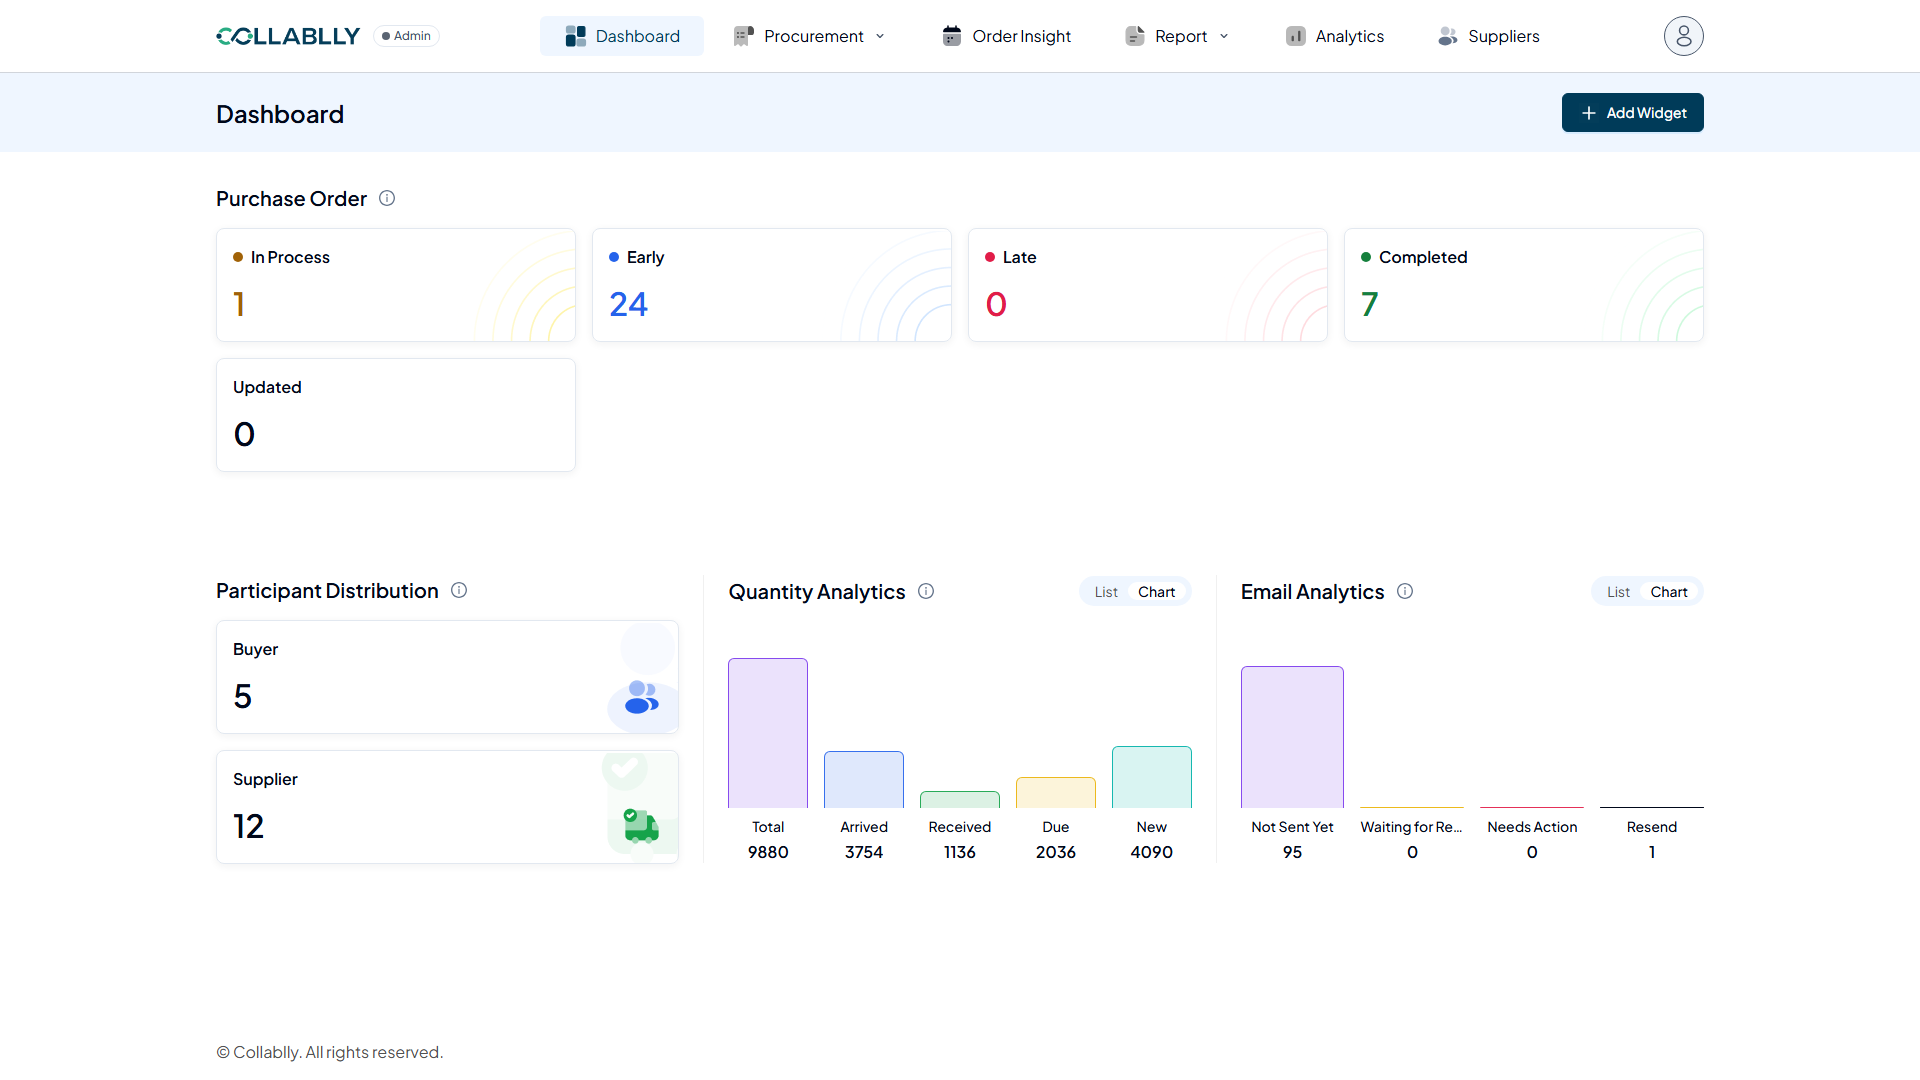
What this page shows
Analytics is a read-only reporting dashboard: two trend charts, a supplier KPI table, a supplier performance breakdown, and a part-level sourcing lookup. Nothing here needs to be filled in.
- Step 3 of 12
Download CSV
Exports the page’s data as a CSV file.
- Step 4 of 12
Print
Opens a print-friendly version of the page.
- Step 5 of 12
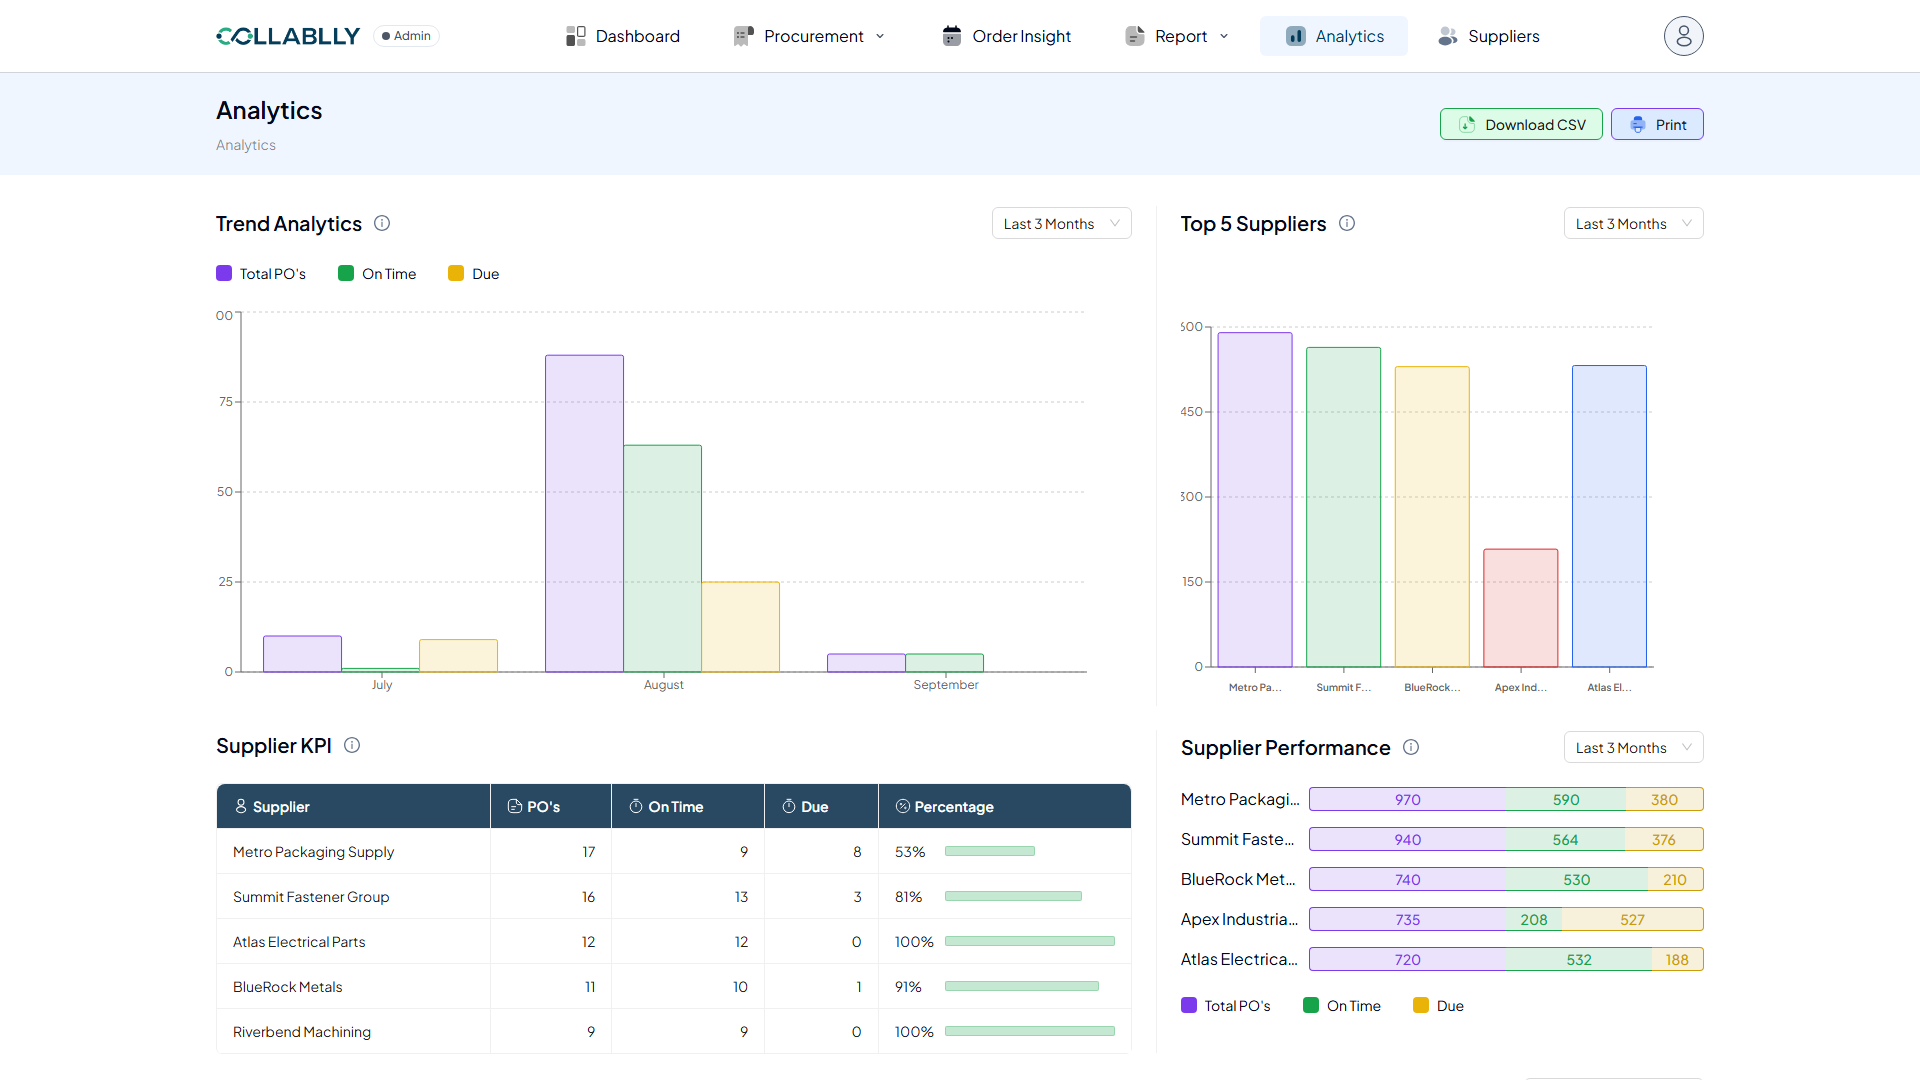
Trend Analytics
A monthly bar chart of Total PO’s, On Time, and Due, so you can see order volume and on-time performance trending together.
- Step 6 of 12
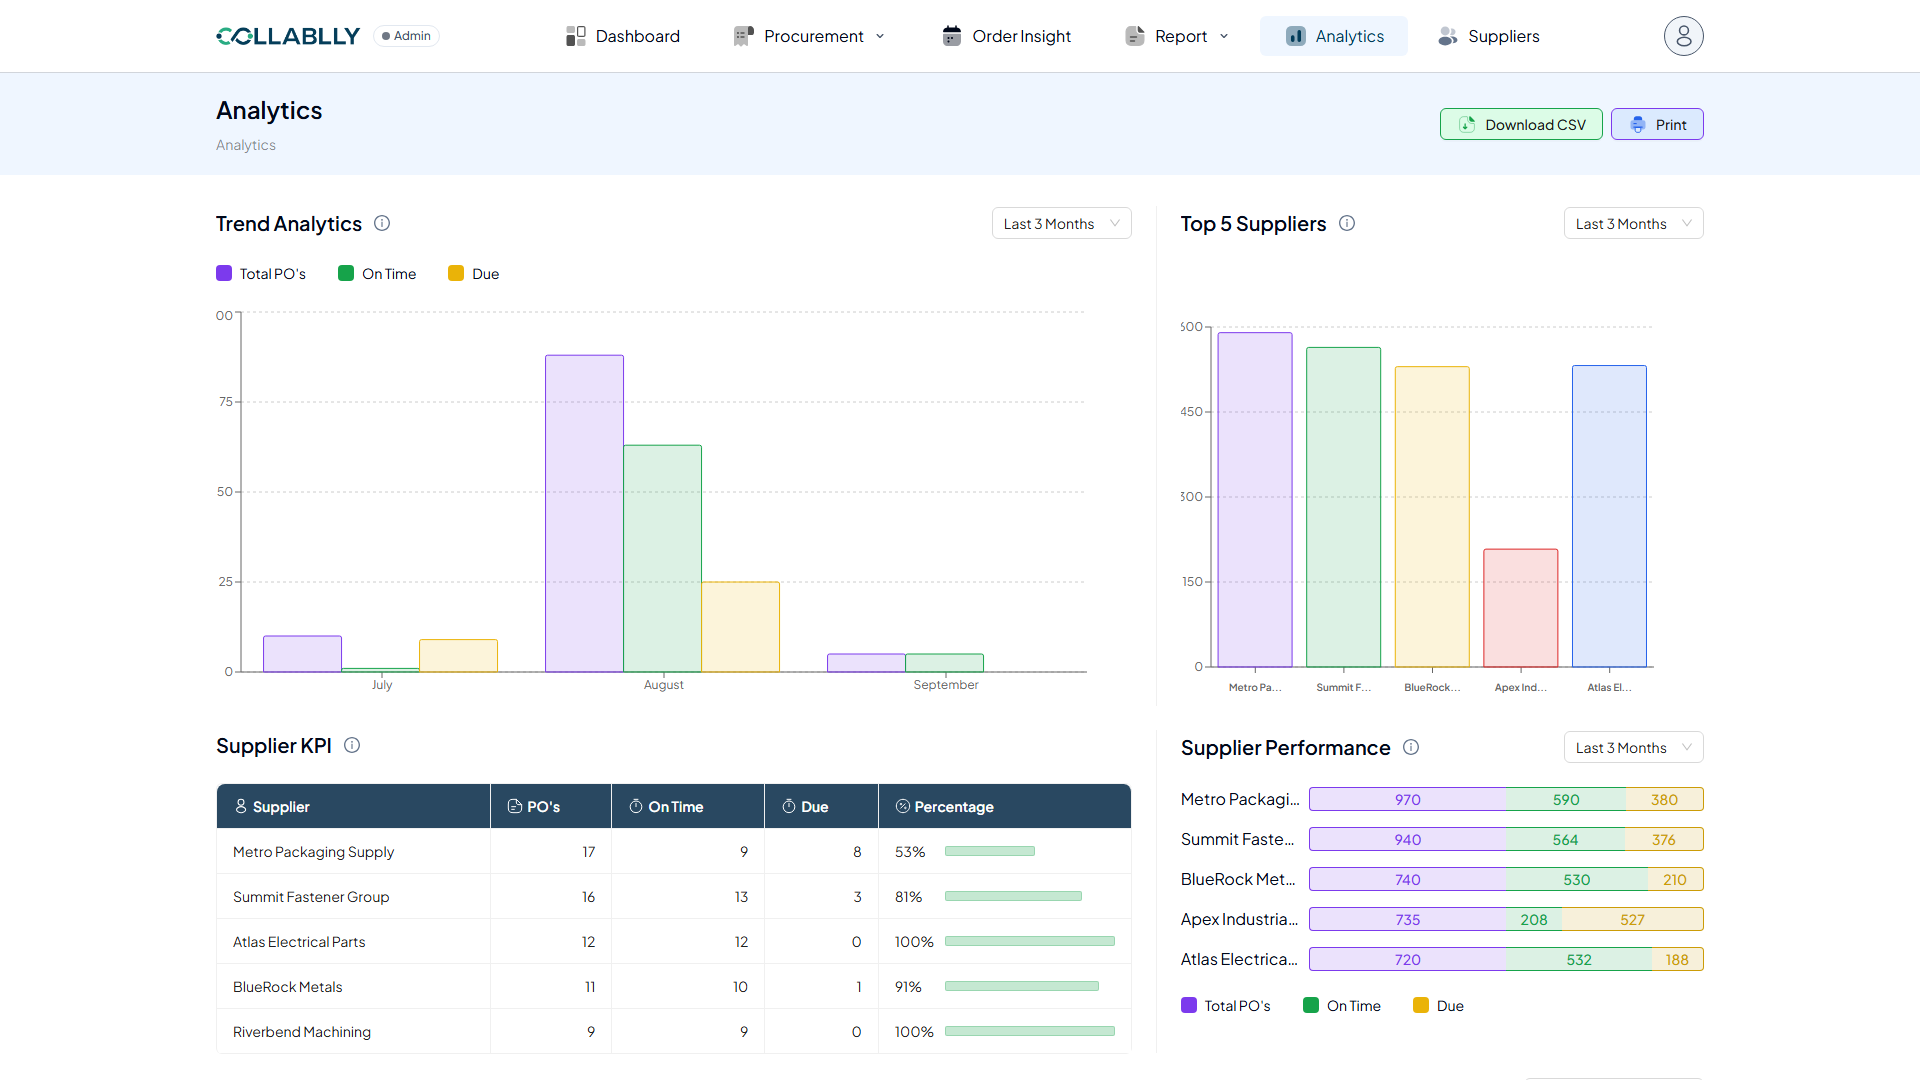
Change the date range
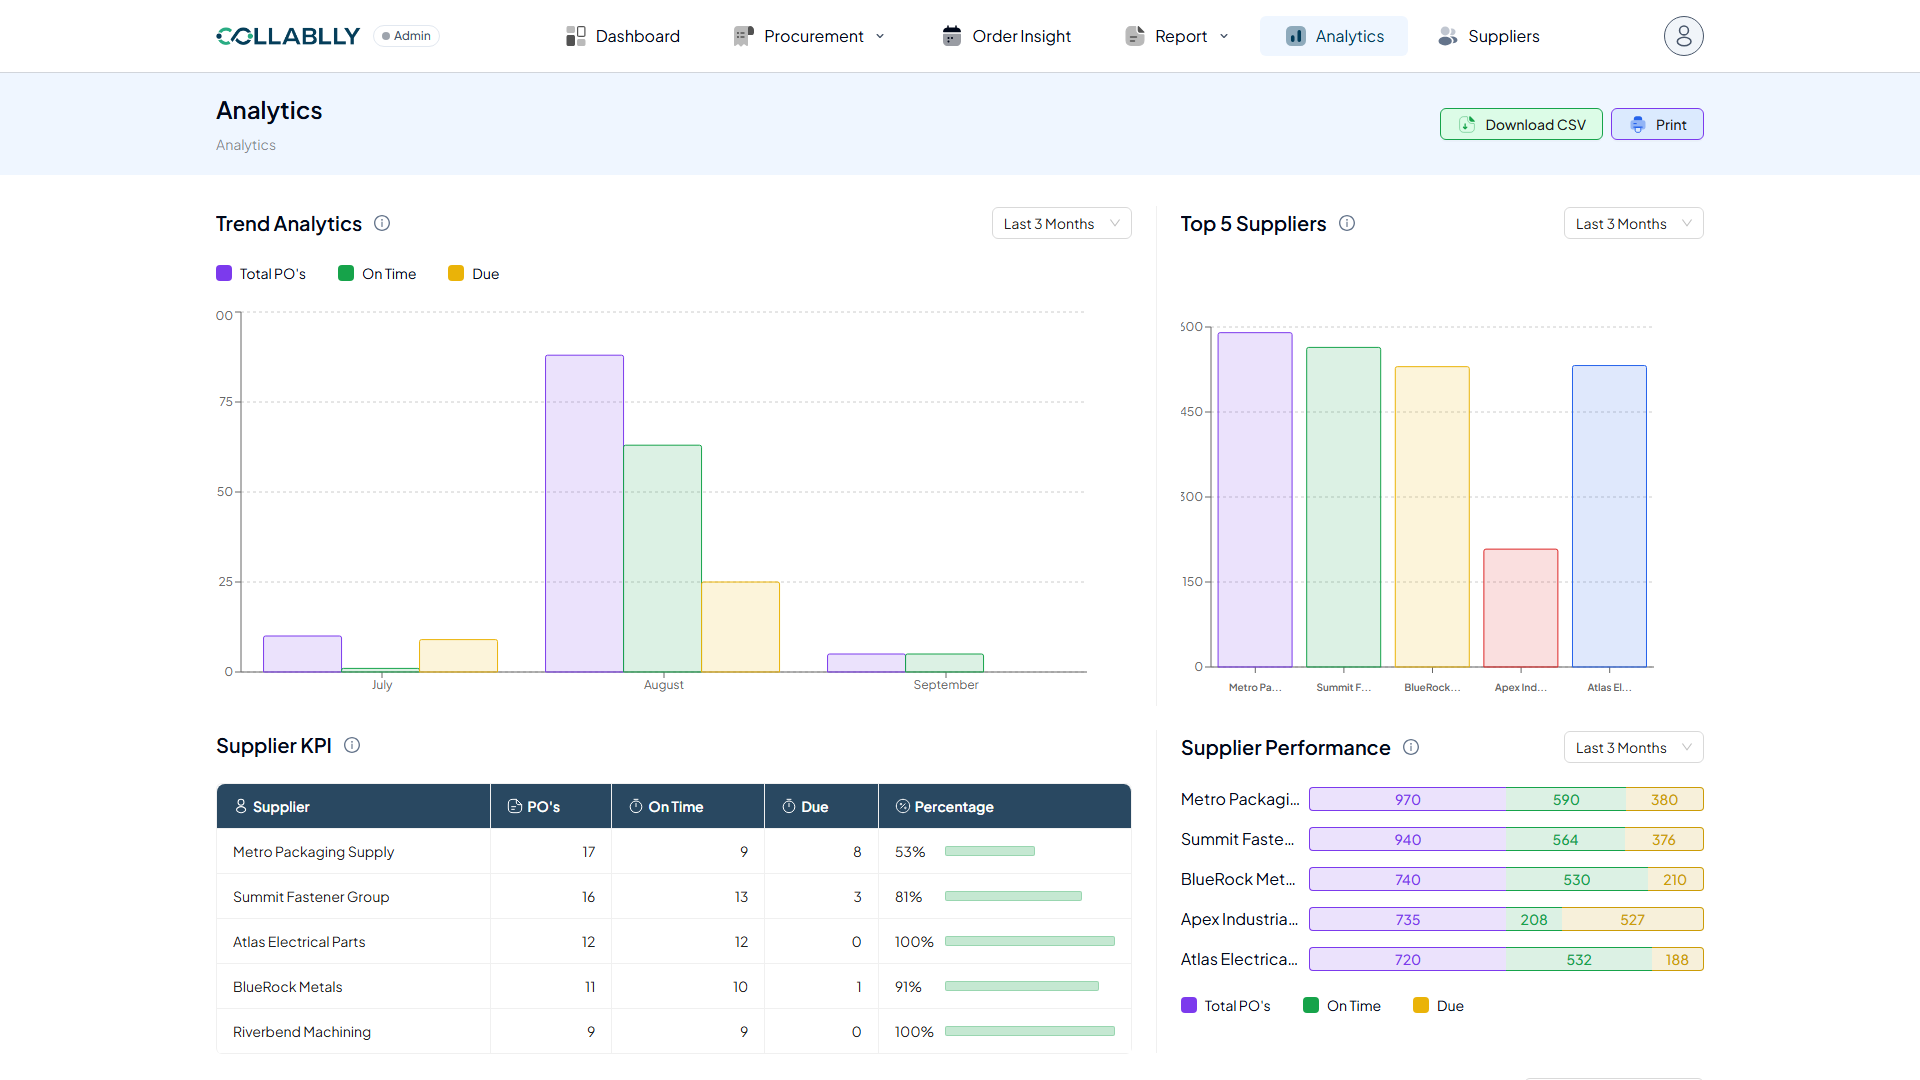
Switch between Last 3, 6, 9, or 12 Months to widen or narrow the trend window.
- Step 7 of 12
Available ranges
Last 3 Months, Last 6 Months, Last 9 Months, or Last 12 Months.
- Step 8 of 12
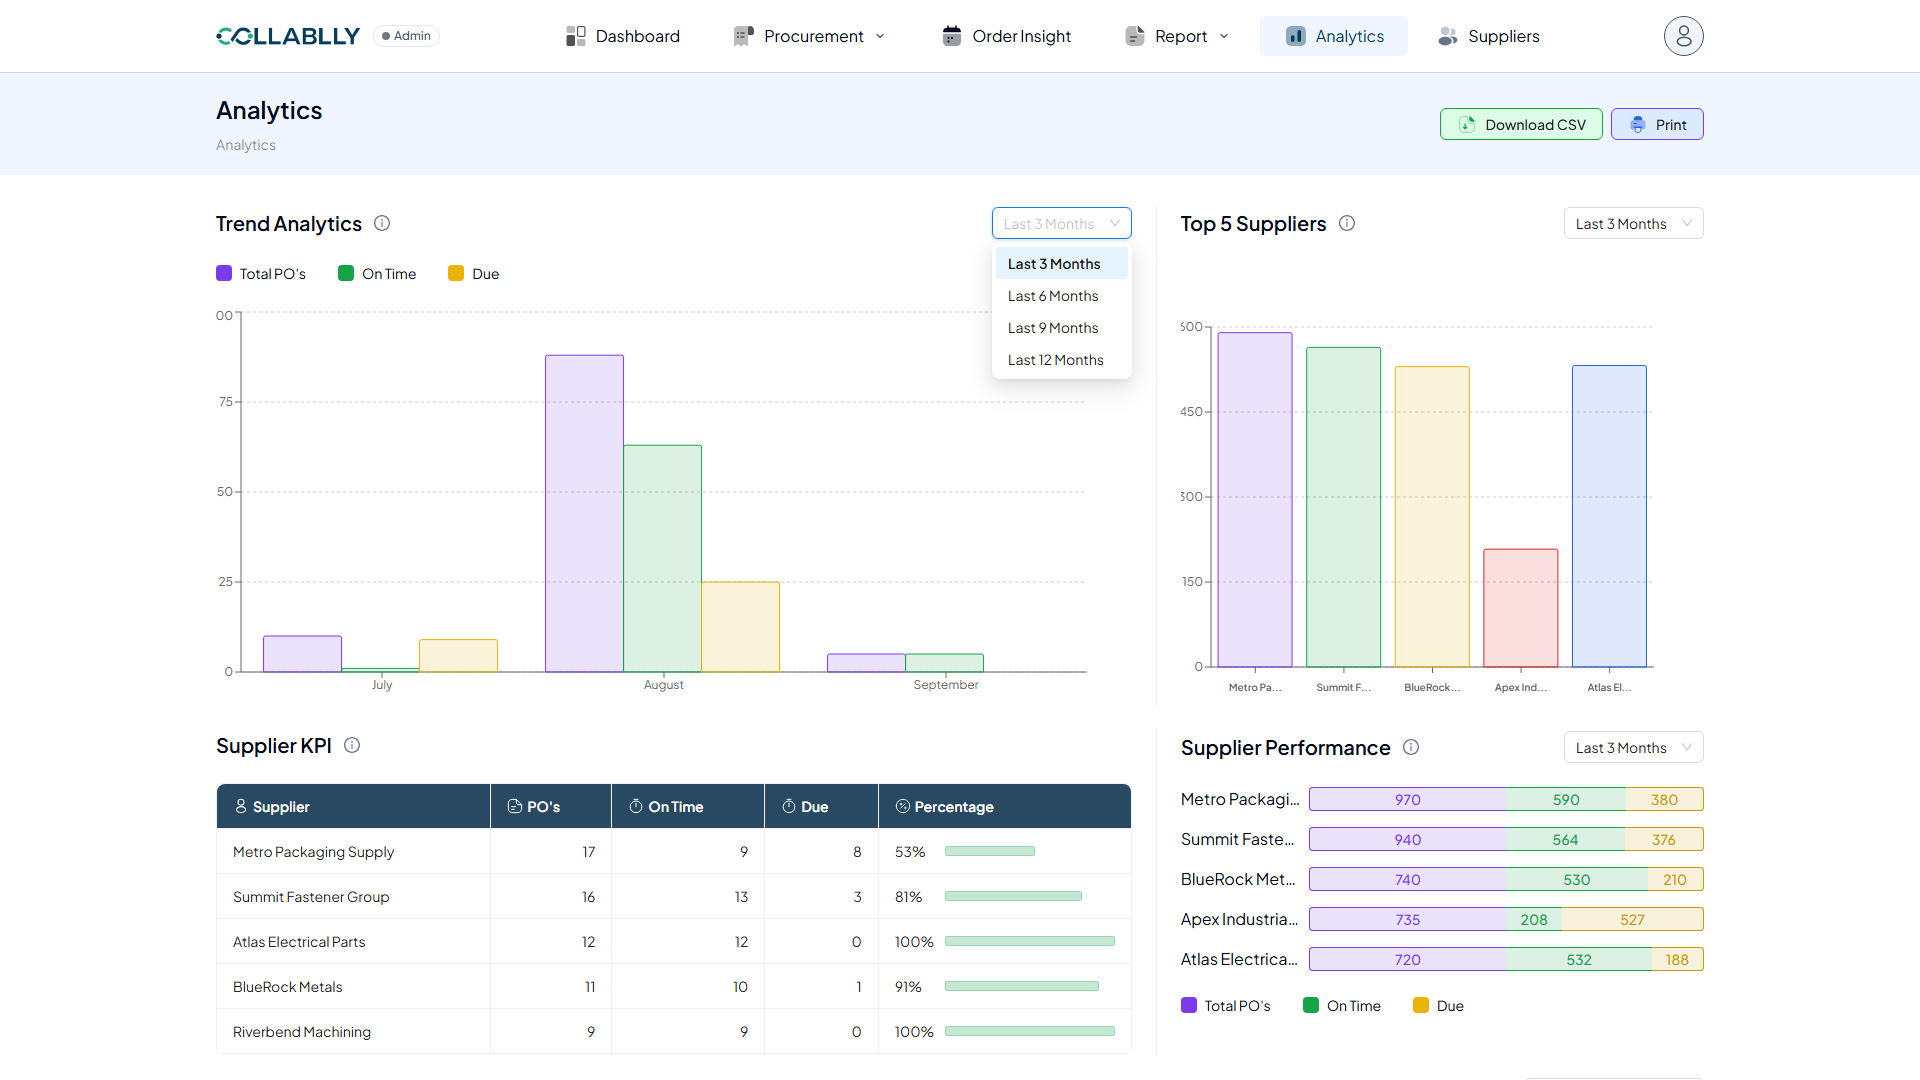
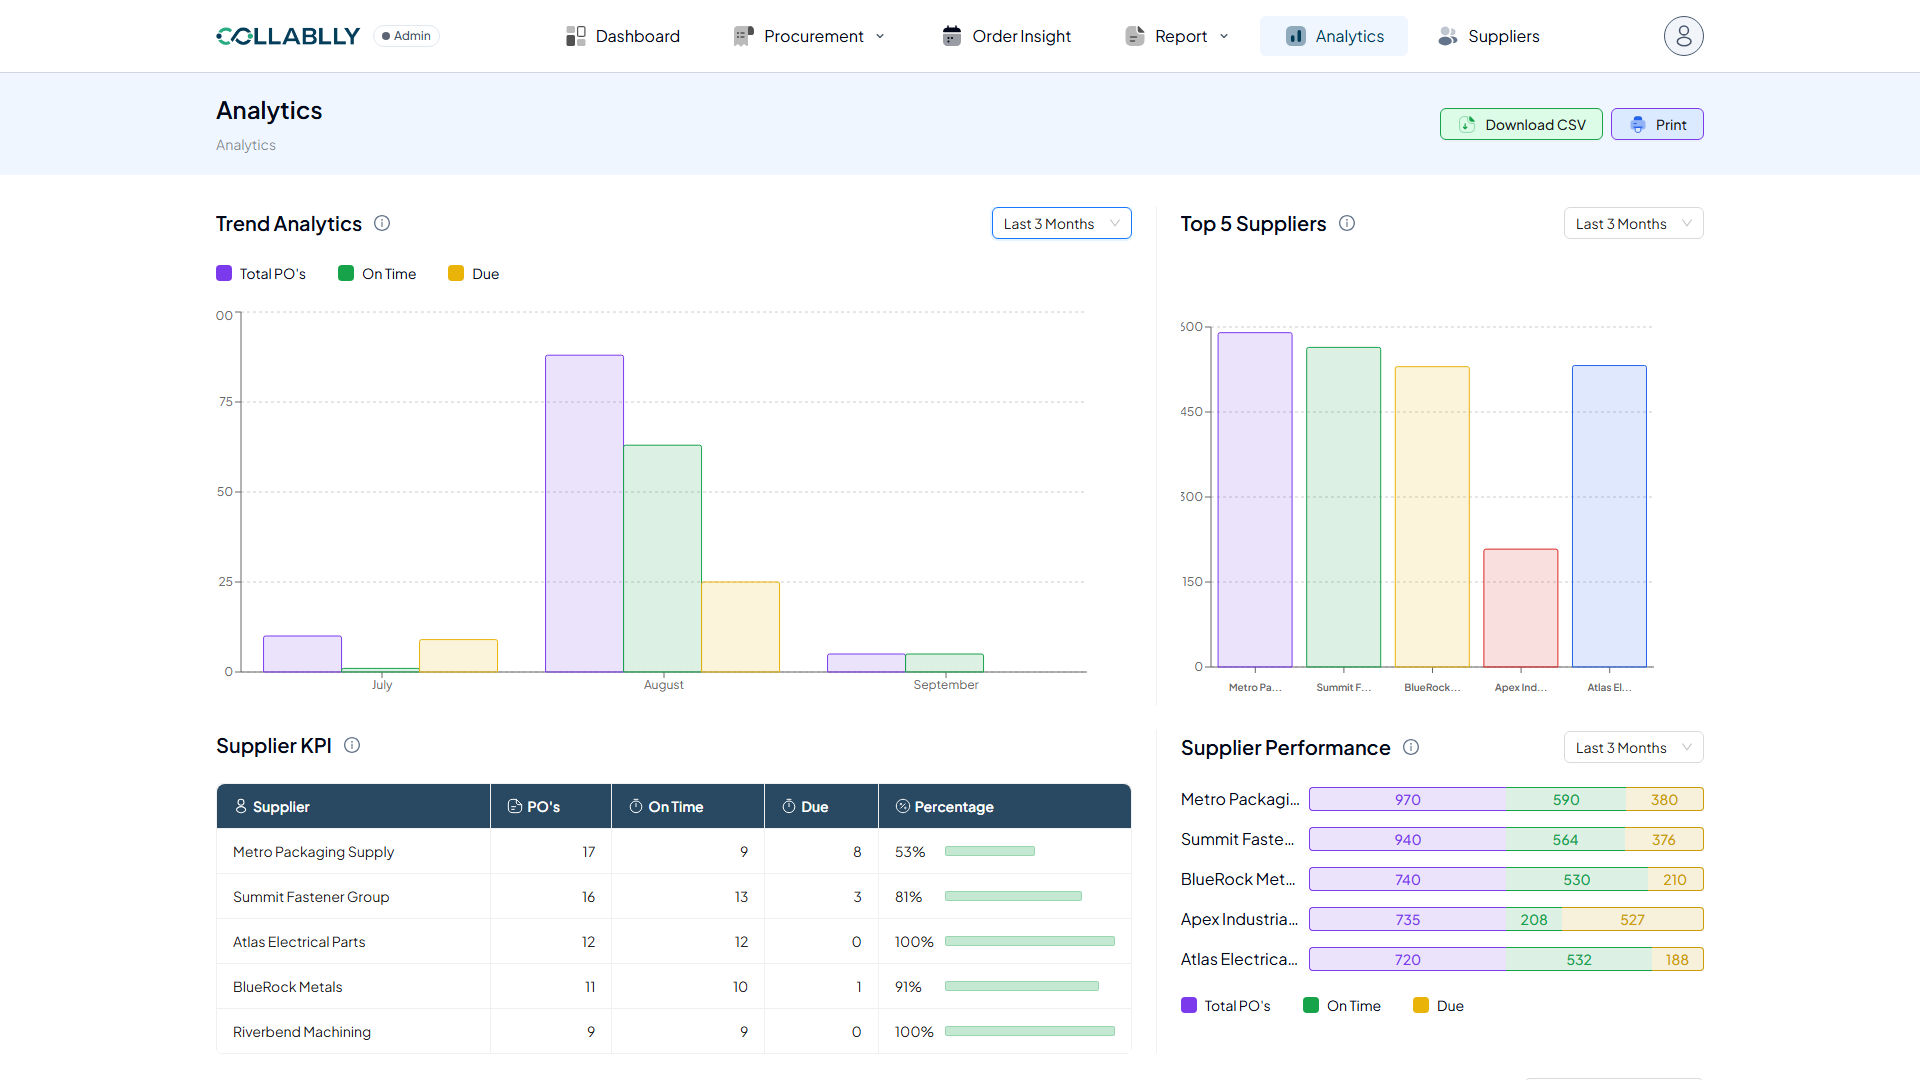
Top 5 Suppliers
A bar chart ranking your five highest-volume suppliers over the selected date range.
- Step 9 of 12
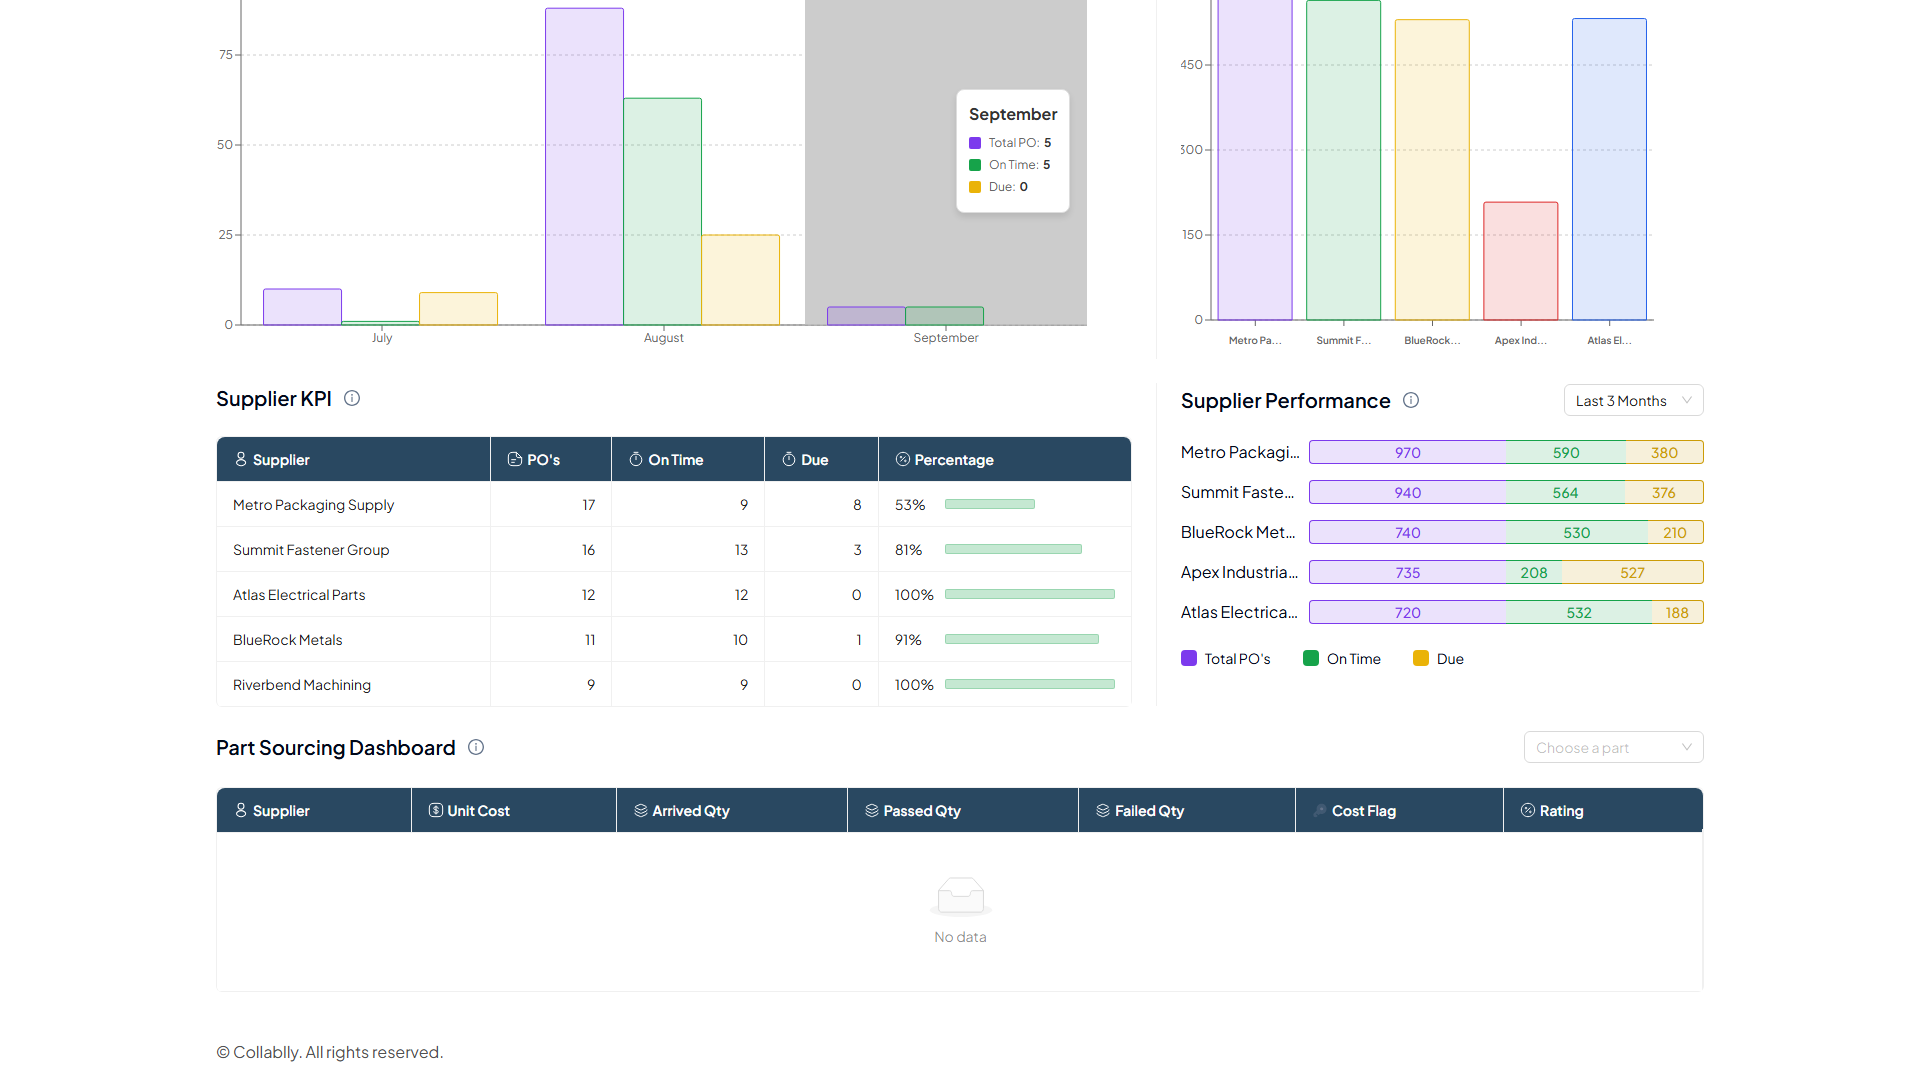
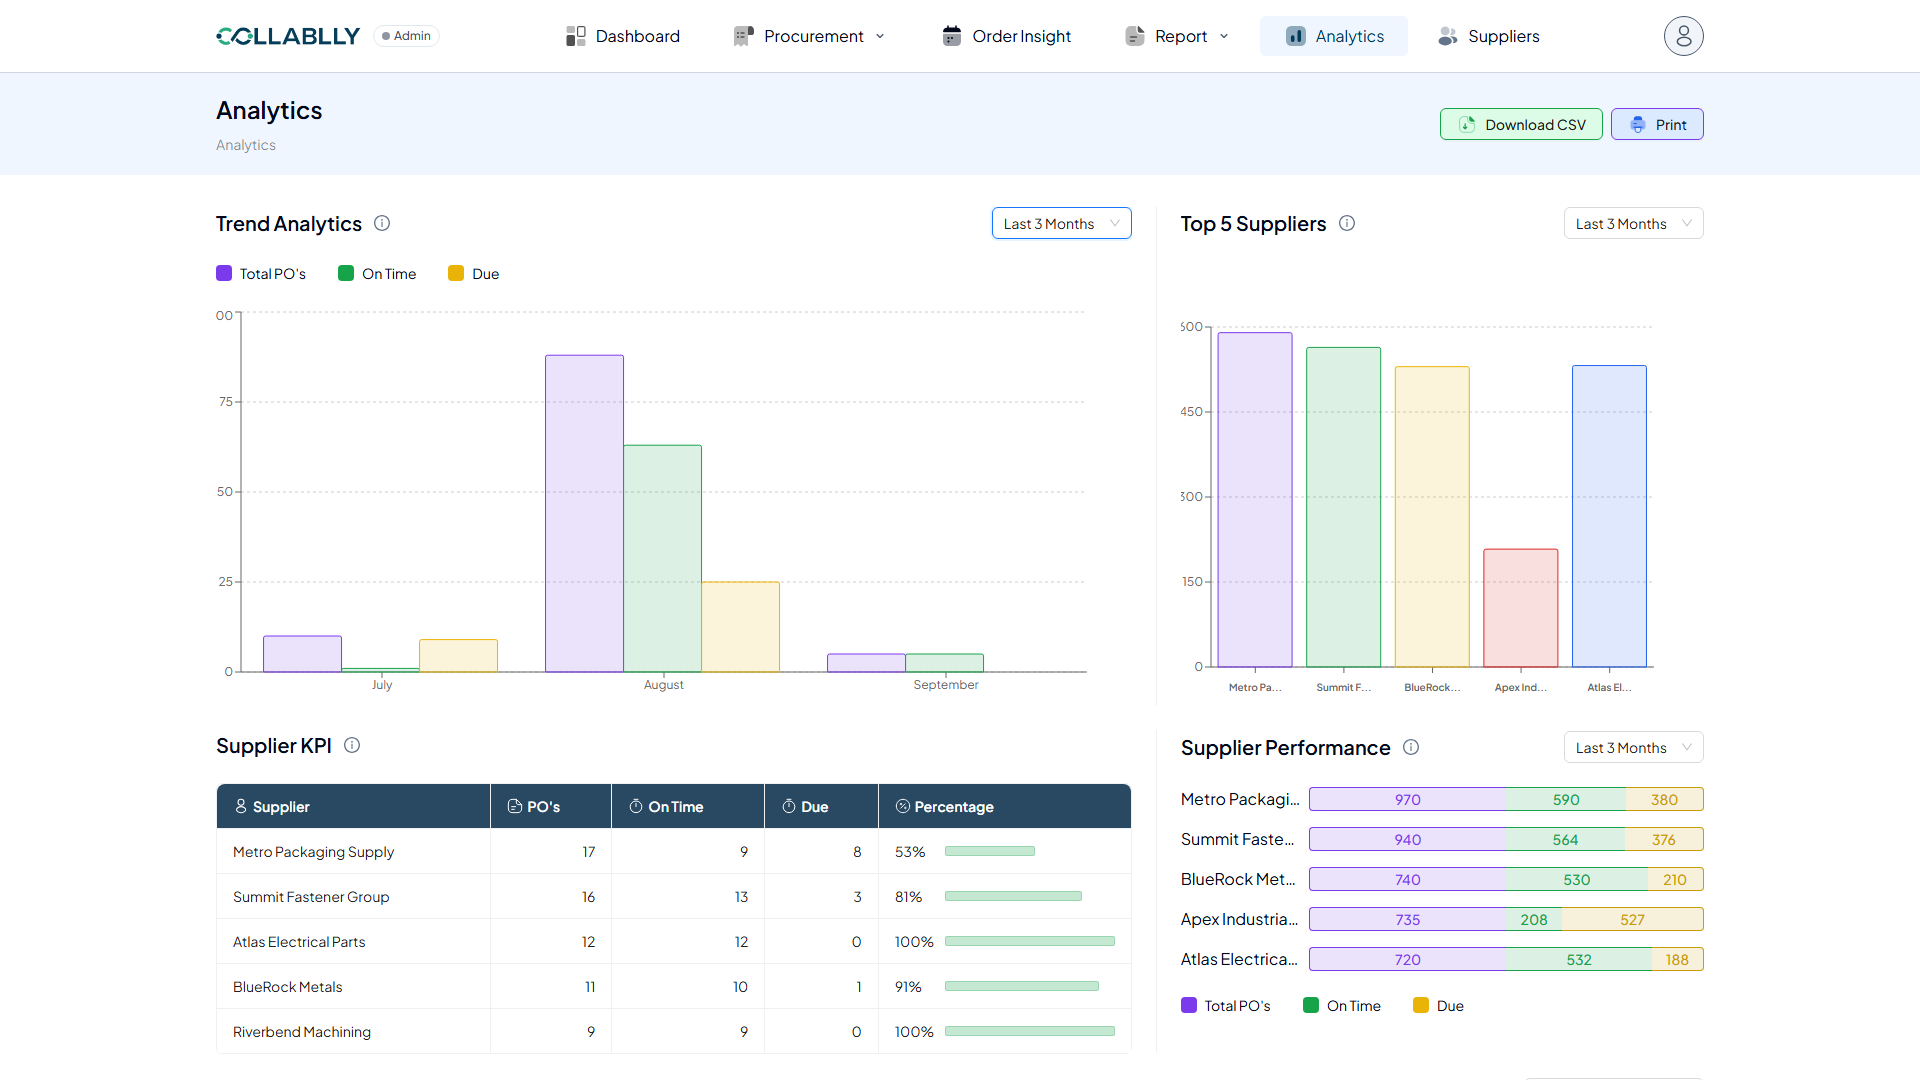
Supplier KPI
A table of every supplier’s PO count, how many were On Time, how many are Due, and the resulting on-time Percentage as a progress bar.
- Step 10 of 12
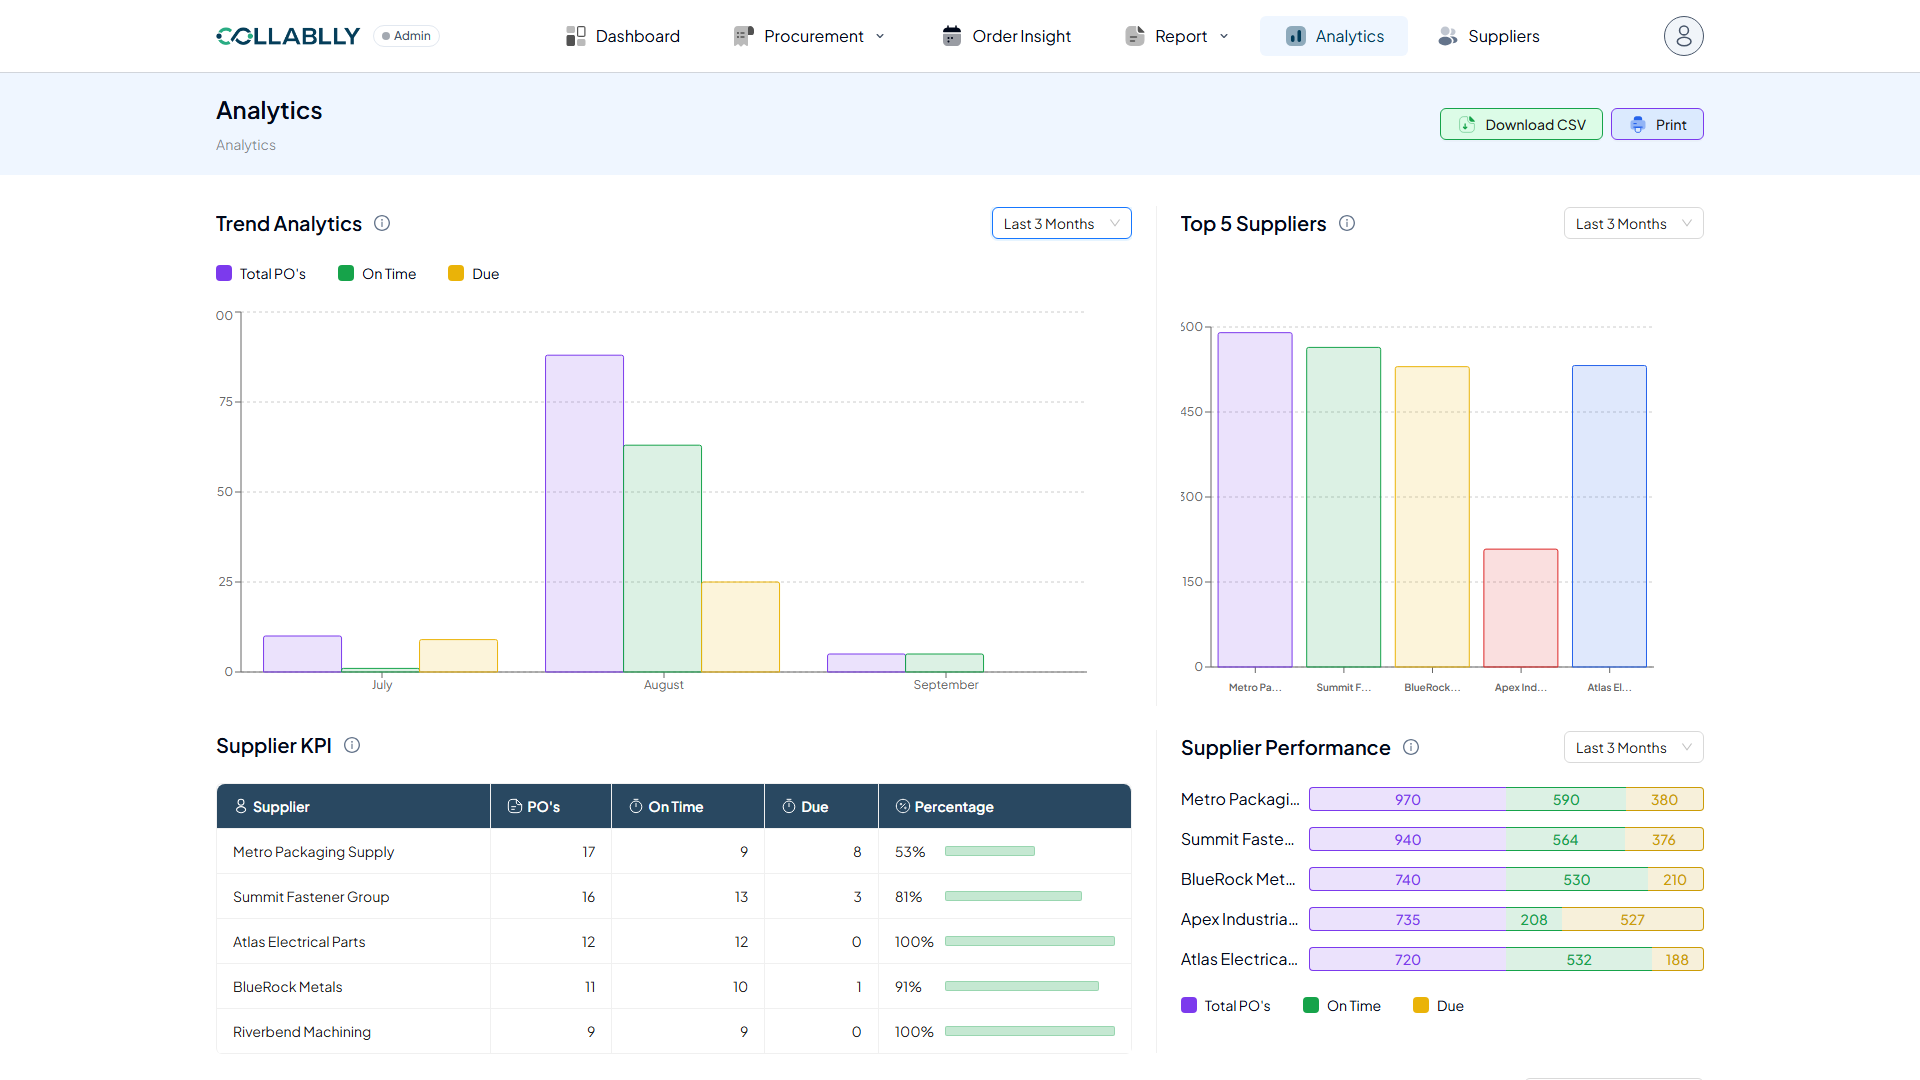
Supplier Performance
The same Total PO’s, On Time, and Due breakdown as Trend Analytics, but shown per supplier instead of per month.
- Step 11 of 12
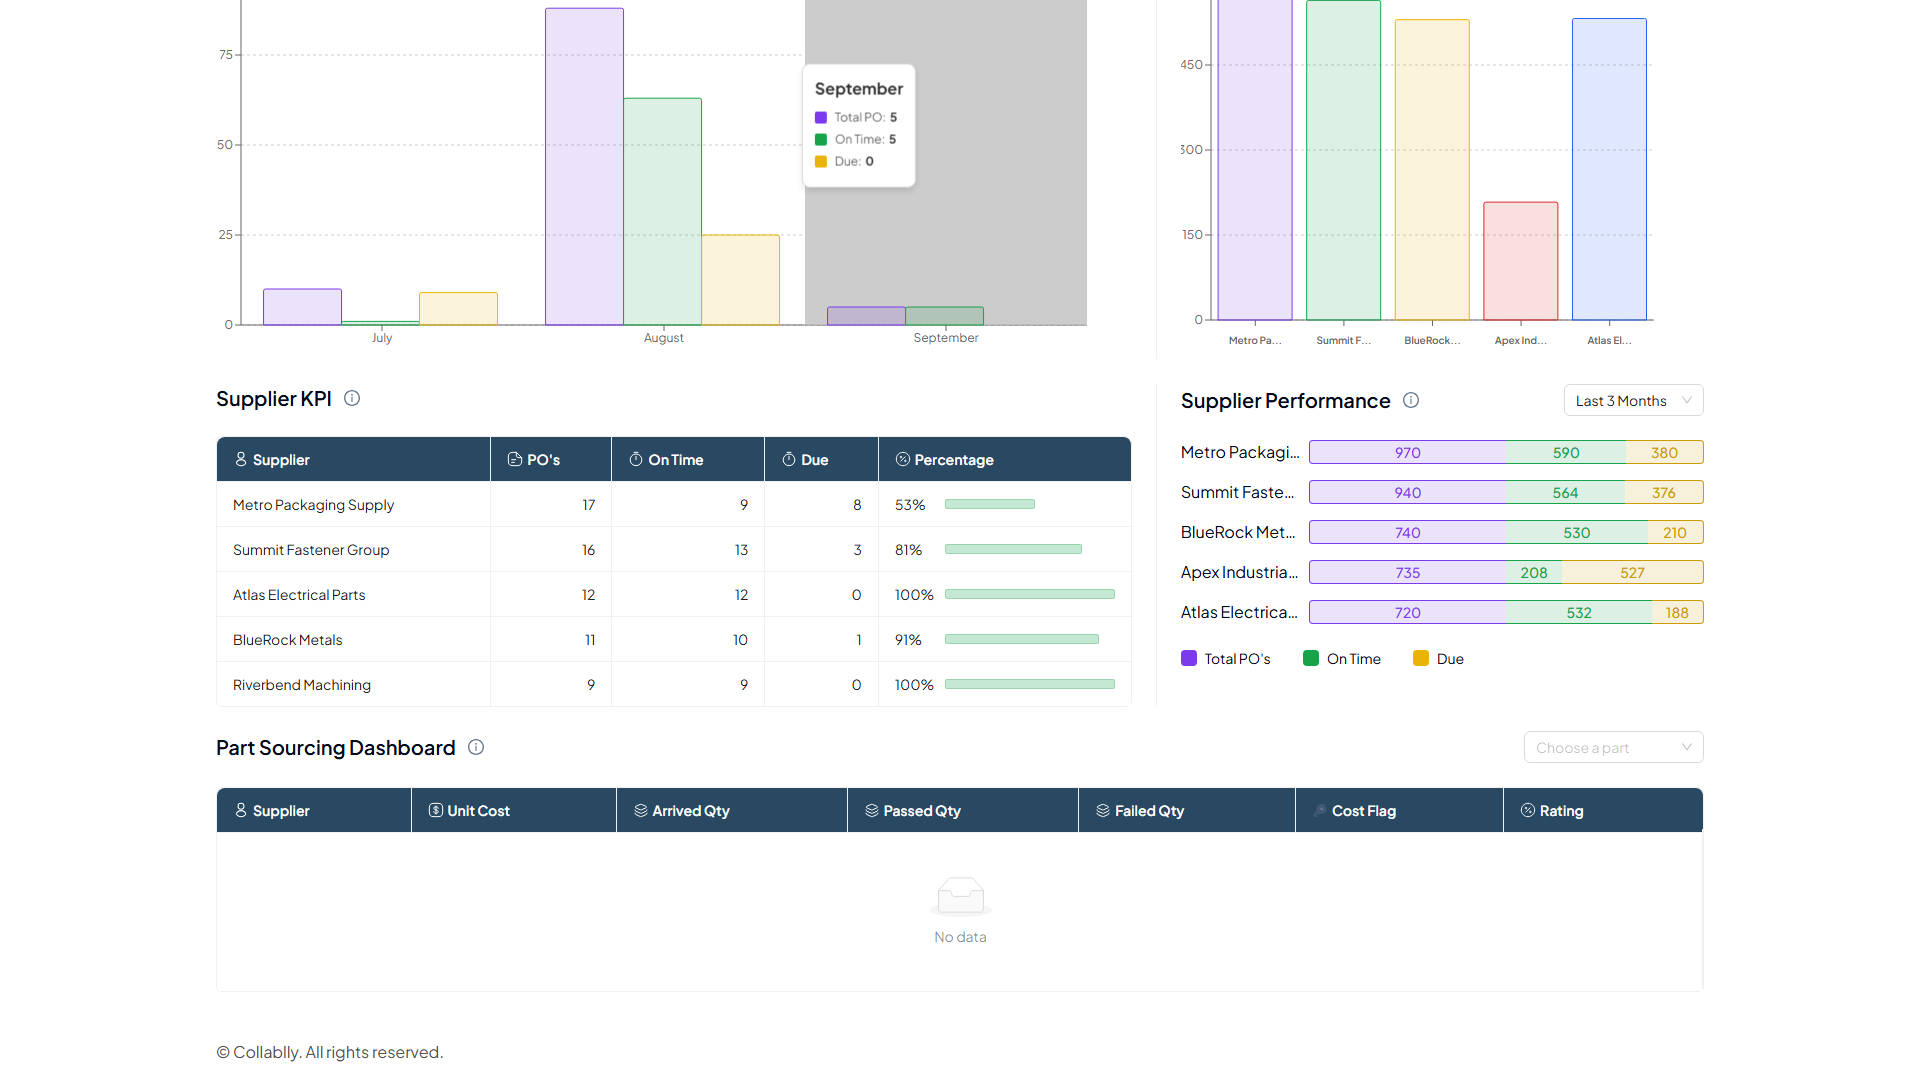
Part Sourcing Dashboard
Look up a single part to see it broken down by supplier: Unit Cost, Arrived Qty, Passed Qty, Failed Qty, Cost Flag, and Rating. Empty until you choose a part.
- Step 12 of 12
Choose a part
Select a part number to populate the table above with every supplier that has sourced it.